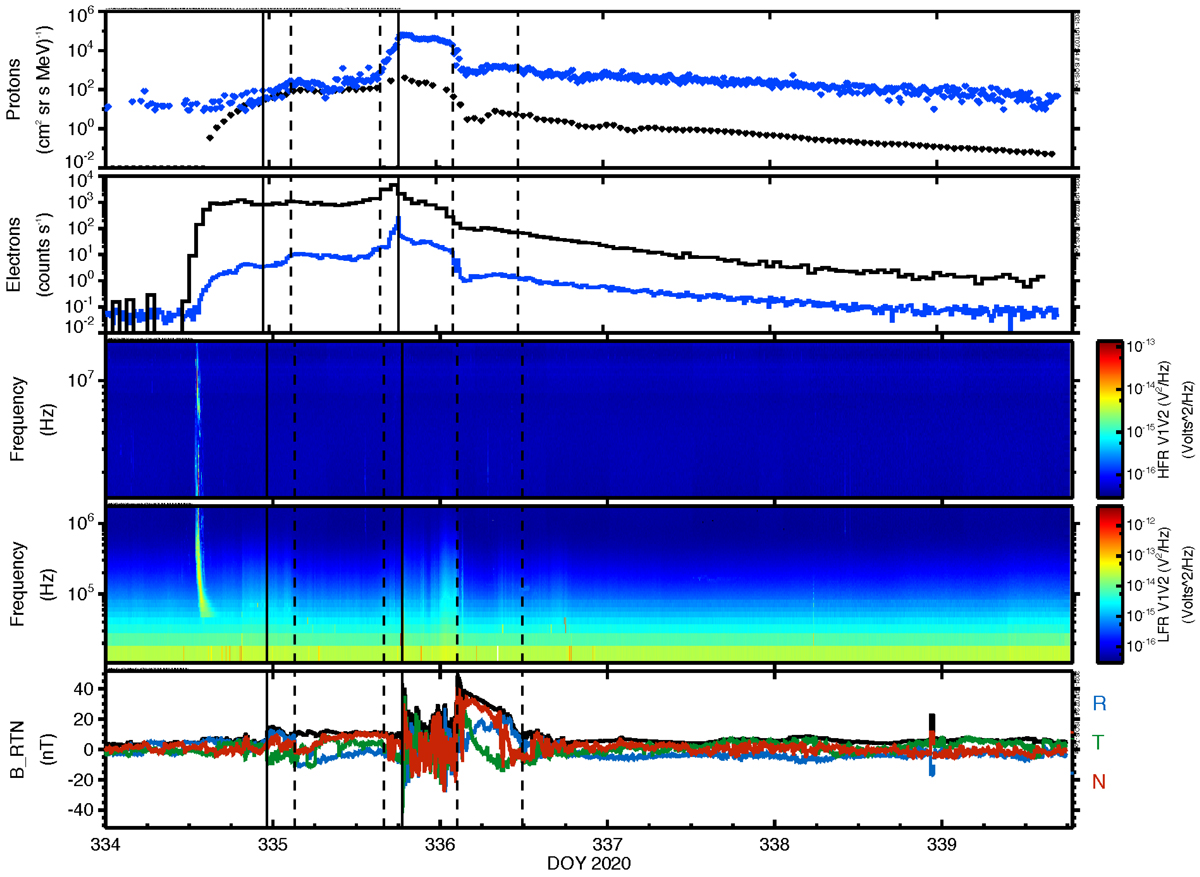
Fig. 12.
Download original image
Overview of the SEP event showing proton intensities at 0.5 and 10 MeV (top panel, blue and black traces, respectively), electron rates at 150 keV and 1 MeV (second panel, blue and black traces respectively), and the radio and magnetic field data (bottom three panels). The time of the shock passages are marked by the solid vertical lines and the periods of the magnetic clouds are bounded by the pairs of dashed vertical lines.
Current usage metrics show cumulative count of Article Views (full-text article views including HTML views, PDF and ePub downloads, according to the available data) and Abstracts Views on Vision4Press platform.
Data correspond to usage on the plateform after 2015. The current usage metrics is available 48-96 hours after online publication and is updated daily on week days.
Initial download of the metrics may take a while.