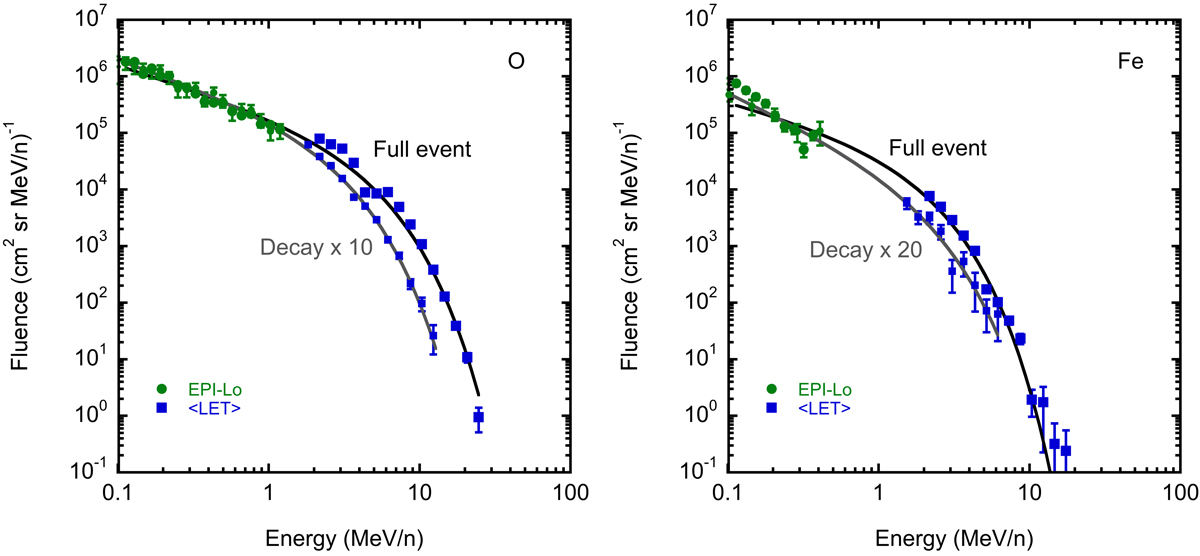
Fig. 11.
Download original image
Comparison of the fluence spectra obtained for the full event (large symbols) and the decay (small symbols; also shown in Fig. 8) for O and Fe from EPI-Lo (green circles) and the average of LETA and LETB (blue squares). The decay spectra have been scaled (as indicated) to provide agreement near ∼0.3 MeV n−1. The fit parameters are listed in Table 2.
Current usage metrics show cumulative count of Article Views (full-text article views including HTML views, PDF and ePub downloads, according to the available data) and Abstracts Views on Vision4Press platform.
Data correspond to usage on the plateform after 2015. The current usage metrics is available 48-96 hours after online publication and is updated daily on week days.
Initial download of the metrics may take a while.