Fig. 3.
Download original image
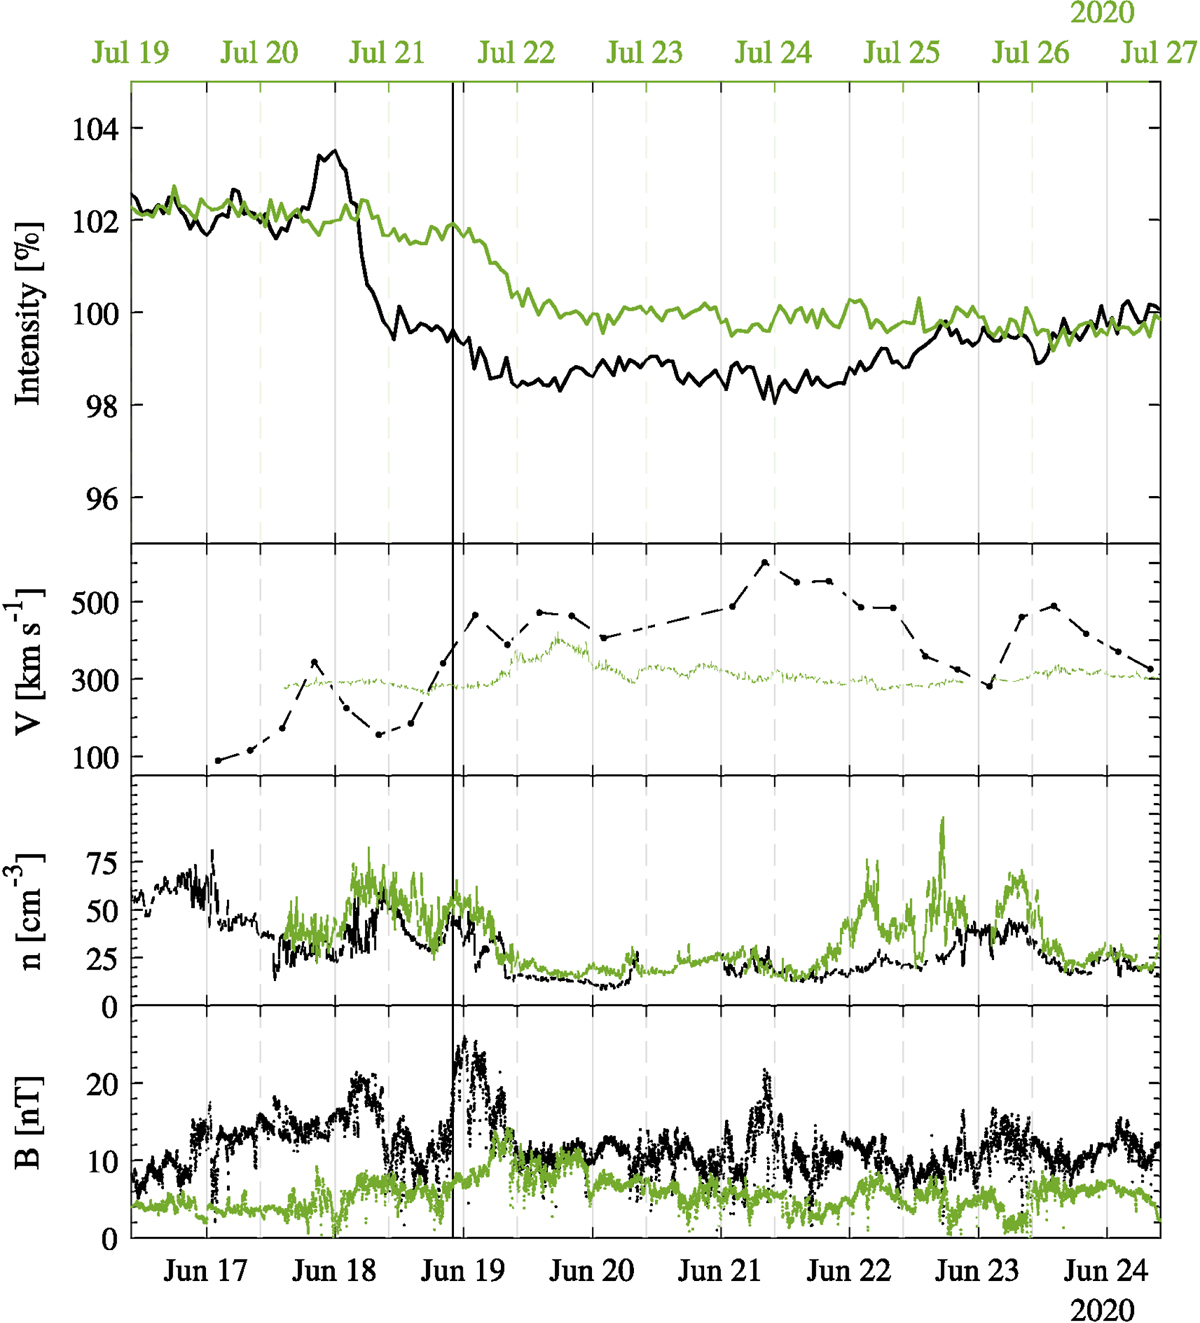
GCR depressions. From top to bottom: time profile of HET normalised ion count rates, solar wind speed, density, and magnetic field magnitude for the period from 09:36 UT on 16 June to 09:35 UT on 24 June (black lines) and from 00:00 UT on 19 July to 00:00 UT on 27 July (green lines). The time difference between the two periods is 32.6 days. The black vertical line indicates the start of the second GCR depression at 22:00 UT on 18 June.
Current usage metrics show cumulative count of Article Views (full-text article views including HTML views, PDF and ePub downloads, according to the available data) and Abstracts Views on Vision4Press platform.
Data correspond to usage on the plateform after 2015. The current usage metrics is available 48-96 hours after online publication and is updated daily on week days.
Initial download of the metrics may take a while.