Fig. 6.
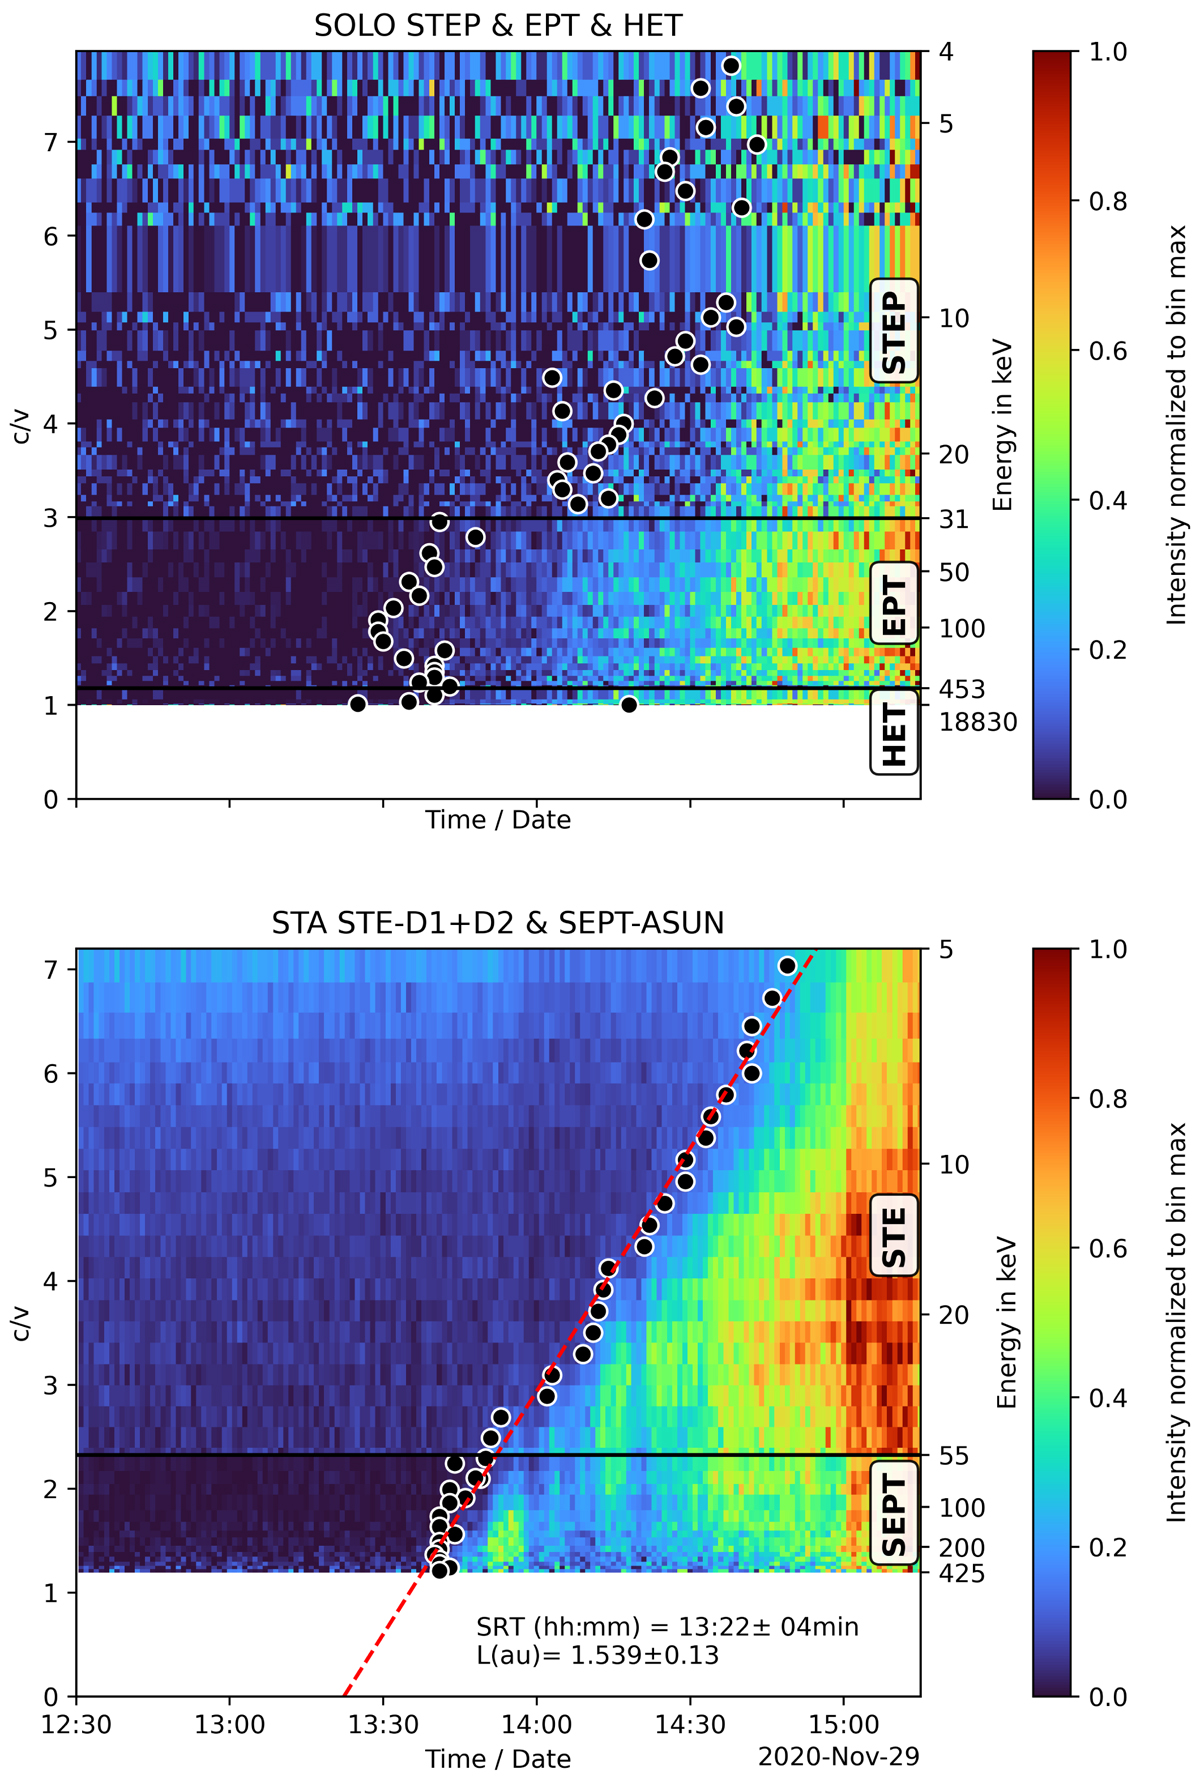
Download original image
60 second time resolution c/v vs. time plots for electrons observed by SolO STEP, EPT, and HET (top panel) and STEREO STE D1 + D2 and SEPT-ASUN (bottom panel). The color scale represents intensities normalized to maximum intensity in the respective energy channel. Black horizontal lines separate the instruments. Black Points mark the onset times derived with the Possion-CUSUM method. The red dashed line in the bottom panel represents the linear fit for VDA.
Current usage metrics show cumulative count of Article Views (full-text article views including HTML views, PDF and ePub downloads, according to the available data) and Abstracts Views on Vision4Press platform.
Data correspond to usage on the plateform after 2015. The current usage metrics is available 48-96 hours after online publication and is updated daily on week days.
Initial download of the metrics may take a while.