Fig. 4.
Download original image
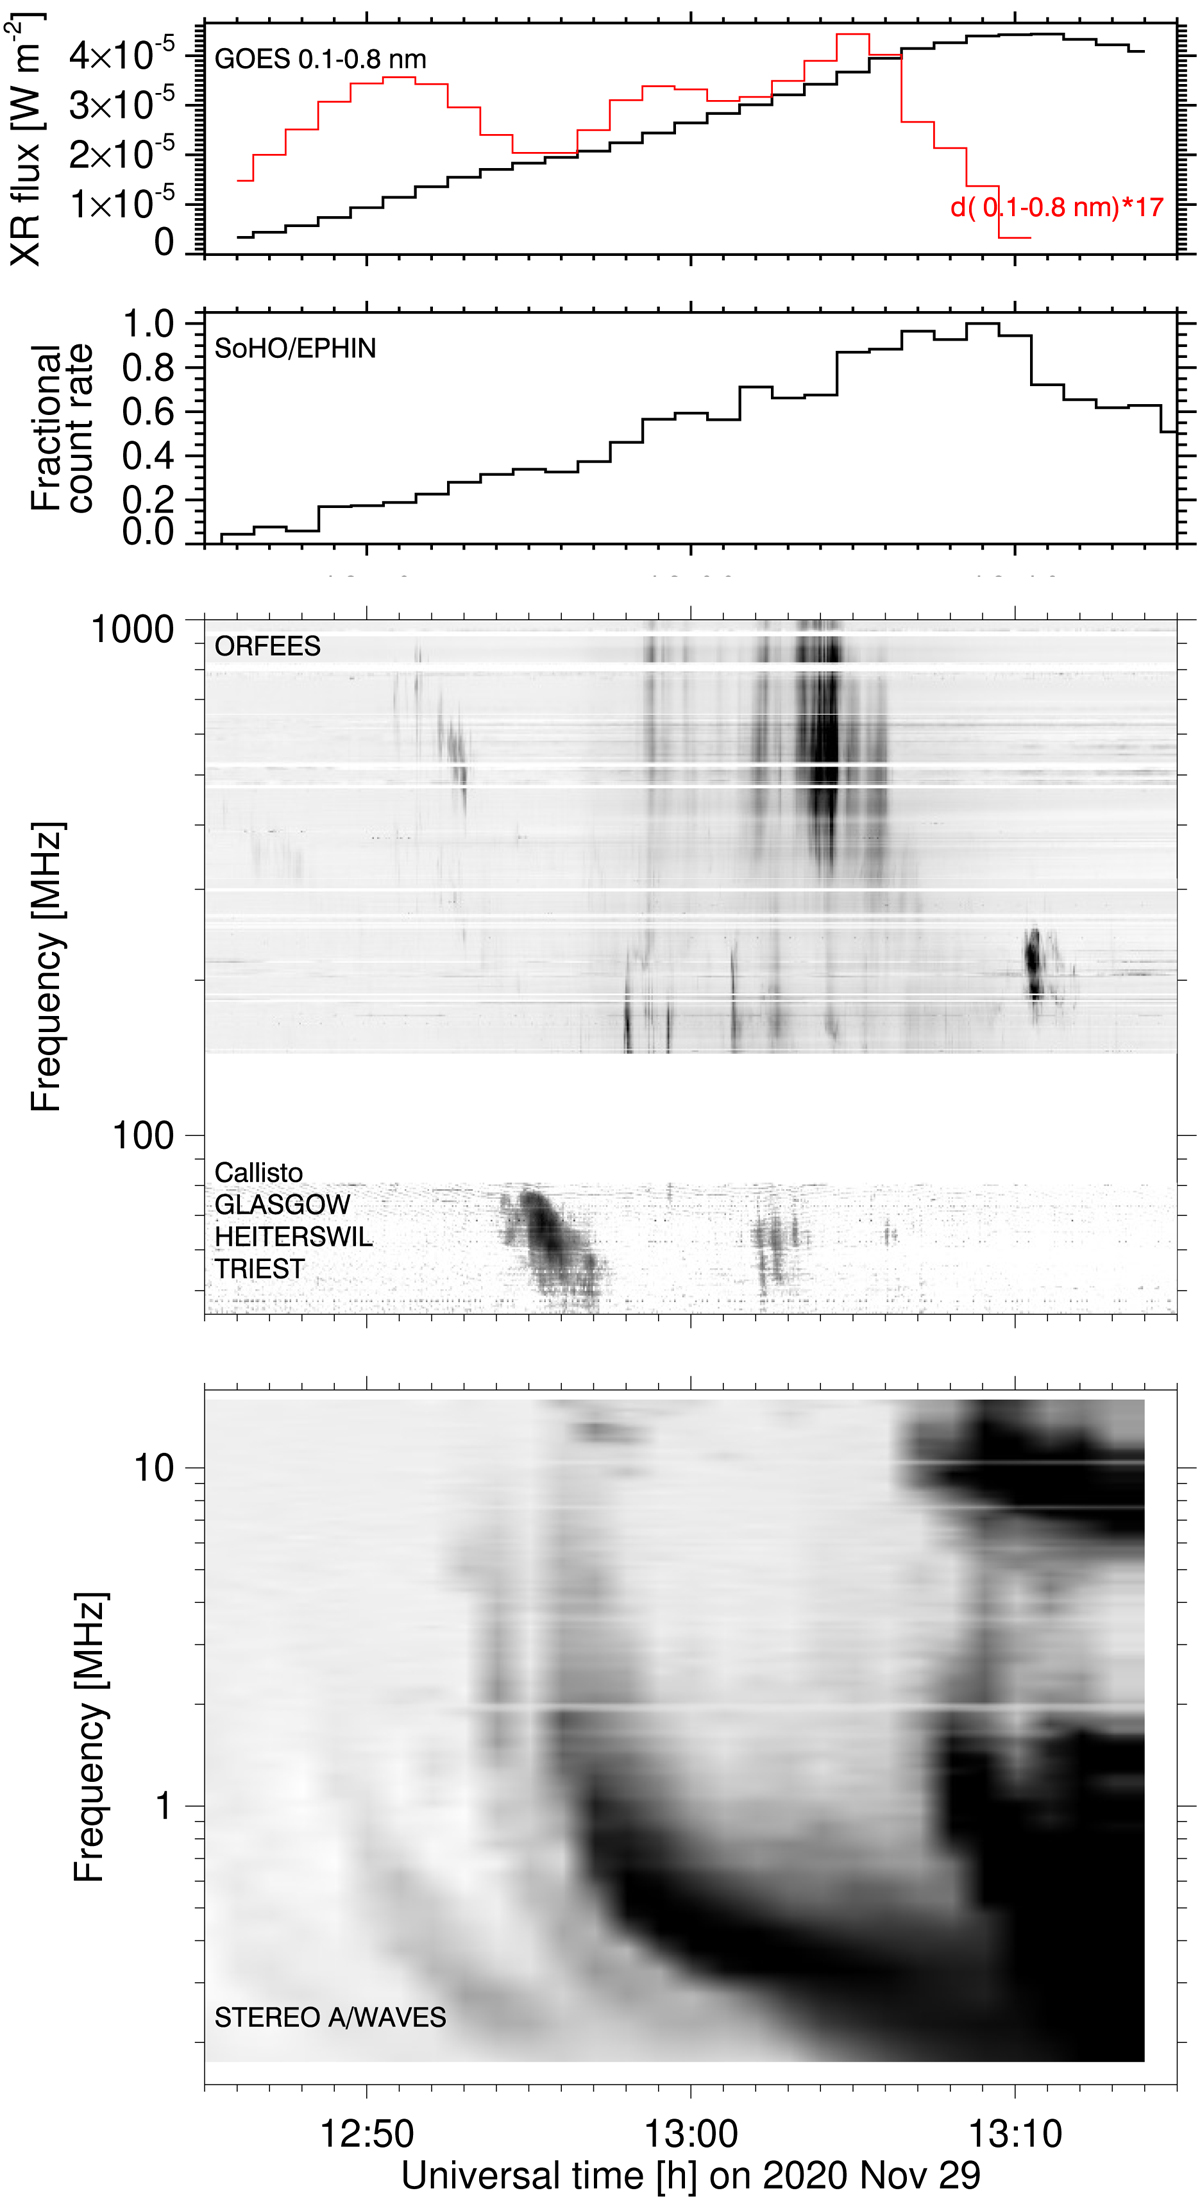
Time history of the X-ray emission and dynamic spectrograms of the 2020 November 29 solar burst. From top to bottom: (1) time history in soft X-rays and its time derivative (red); (2) count rate time history due to hard X-rays in the SOHO/EPHIN detector; dynamic radio spectrograms in the frequency ranges (3) 144 − 1000 MHz, (4) 41 − 85 MHz, (5) 0.15 − 16 MHz.
Current usage metrics show cumulative count of Article Views (full-text article views including HTML views, PDF and ePub downloads, according to the available data) and Abstracts Views on Vision4Press platform.
Data correspond to usage on the plateform after 2015. The current usage metrics is available 48-96 hours after online publication and is updated daily on week days.
Initial download of the metrics may take a while.