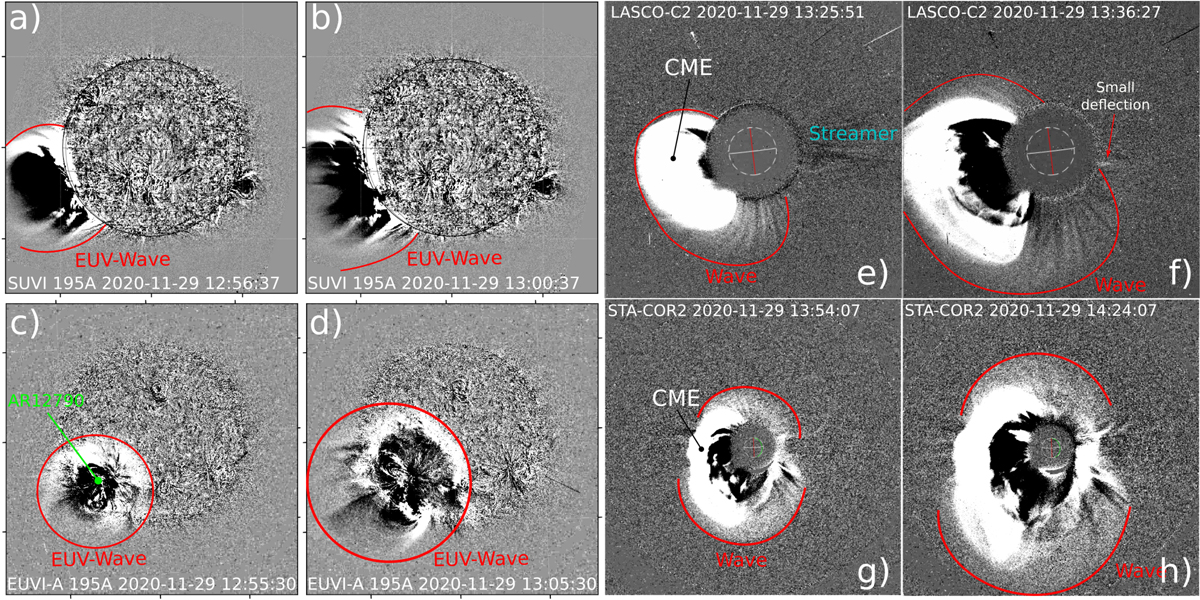
Fig. 3.
Download original image
Remote sensing observations of the EUV wave, the CME, and the white-light shock wave from two different viewpoints. Panels a–d: EUV running-difference images recorded nearly simultaneously from SUVI (a and b) and STEREO-A EUVI (c and d) at 195 Å during the early stages of the EUV wave expansion in the low corona. The EUV wave front is labeled and outlined with the red lines. Panels e–h: running-difference images in white-light from SOHO/LASCO-C2 (e and f) and STEREO-A/COR2 (g and h). The CME is labeled and the white-light shock wave is labeled and outlined with red lines.
Current usage metrics show cumulative count of Article Views (full-text article views including HTML views, PDF and ePub downloads, according to the available data) and Abstracts Views on Vision4Press platform.
Data correspond to usage on the plateform after 2015. The current usage metrics is available 48-96 hours after online publication and is updated daily on week days.
Initial download of the metrics may take a while.