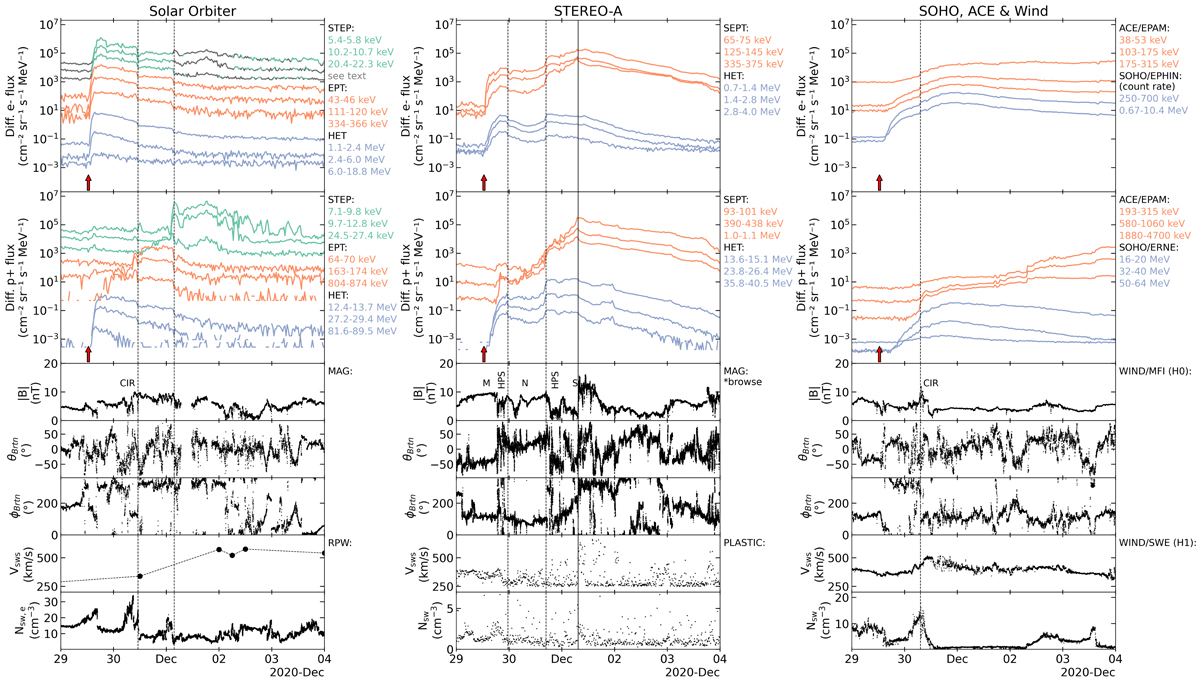
Fig. 2.
Download original image
Time profiles of in situ observations from SolO (left panel), STEREO-A (central panel), and SOHO, ACE at L1 (right panel). Shown from top to bottom are electron fluxes at multiple energies, proton fluxes at multiple energies, magnetic field magnitude, elevation and azimuth angles of the magnetic field vector in RTN coordinates, solar wind speed, and solar wind density. Vertical dashed lines indicate times of abrupt changes in particle intensity. The solid line at STEREO-A indicates passage of a probable shock. Gray lines in the STEP data indicate time periods without clear electron measurements and should be interpreted as an upper limit for the electron flux.
Current usage metrics show cumulative count of Article Views (full-text article views including HTML views, PDF and ePub downloads, according to the available data) and Abstracts Views on Vision4Press platform.
Data correspond to usage on the plateform after 2015. The current usage metrics is available 48-96 hours after online publication and is updated daily on week days.
Initial download of the metrics may take a while.