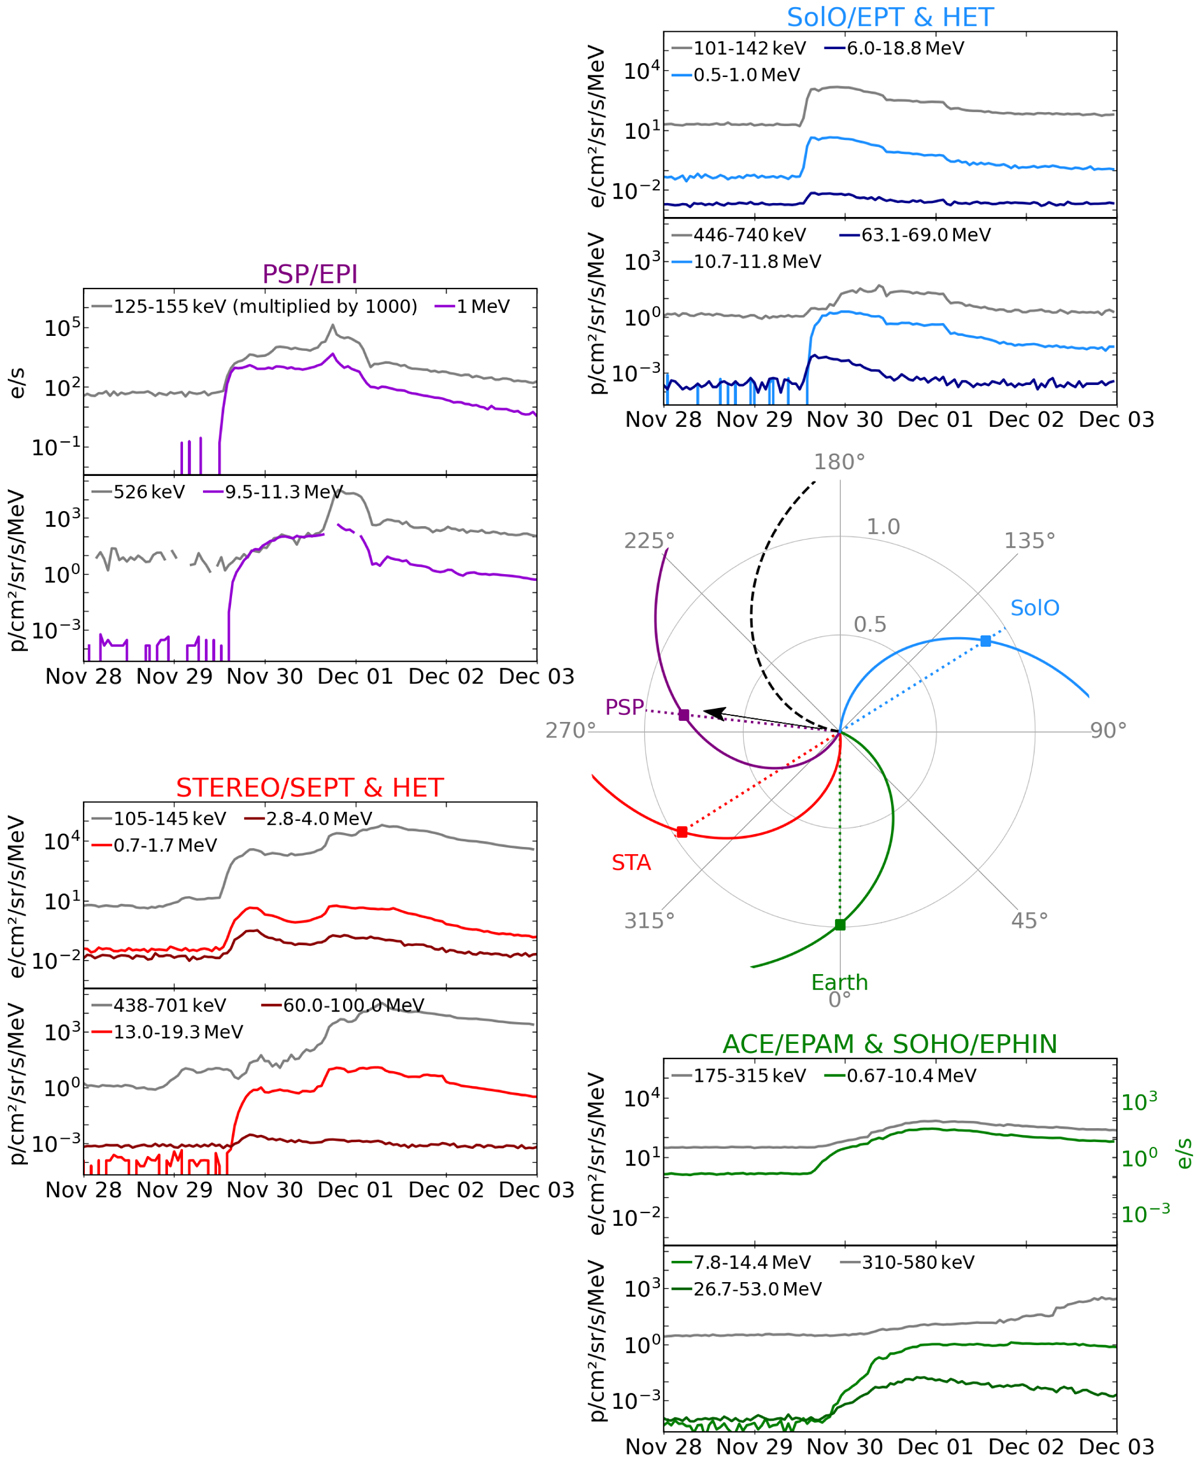
Fig. 1.
Download original image
Overview of the 2020 November 29 SEP event: middle right panel shows the orbital locations of PSP (magenta point), SolO (blue point), STEREO-A (red point), and near-Earth spacecraft (green point) as seen from the north ecliptic. Nominal interplanetary magnetic field (IMF) lines connecting each spacecraft with the Sun considering the solar wind speeds listed in Table 1 are shown in corresponding colors. The black arrow indicates the location of the active region associated with the event (E98 seen from the Earth). Surrounding panels illustrate hourly-averaged proton fluxes (lower panels) and electron fluxes (upper panels) observed by the different spacecraft.
Current usage metrics show cumulative count of Article Views (full-text article views including HTML views, PDF and ePub downloads, according to the available data) and Abstracts Views on Vision4Press platform.
Data correspond to usage on the plateform after 2015. The current usage metrics is available 48-96 hours after online publication and is updated daily on week days.
Initial download of the metrics may take a while.