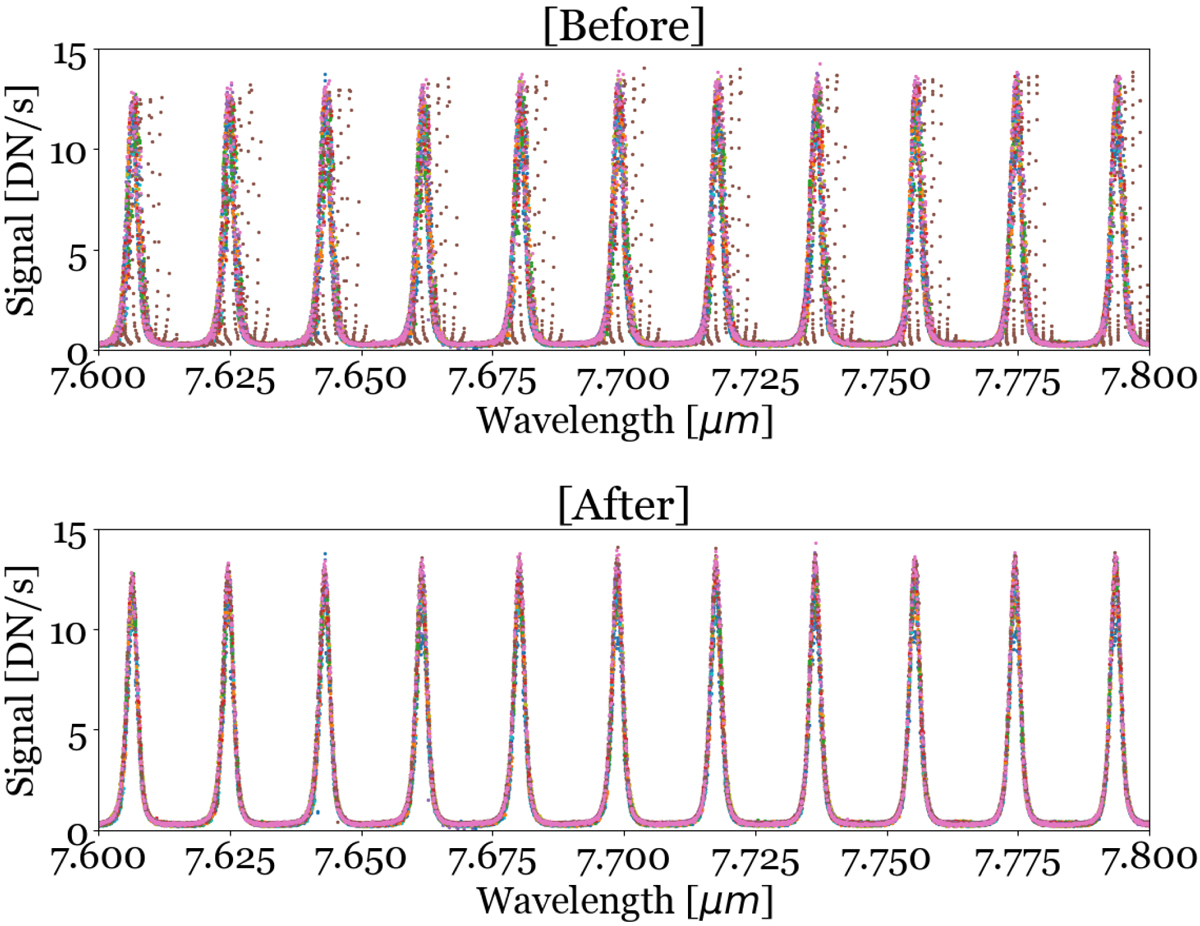
Fig. 8.
Download original image
Internal consistency check of the wavelength solution within a sub-band. The top panel shows a sub-optimal wavelength calibration of sub-band 2A. The misalignment of lines introduced by the uncertainties in the cross calibration of a few iso-α lines and slices is clearly seen as a shift to the right from the main “oversampled” lines. The bottom panel shows the resulting etalon spectrum once the uncertainties in the calibration have been addressed.
Current usage metrics show cumulative count of Article Views (full-text article views including HTML views, PDF and ePub downloads, according to the available data) and Abstracts Views on Vision4Press platform.
Data correspond to usage on the plateform after 2015. The current usage metrics is available 48-96 hours after online publication and is updated daily on week days.
Initial download of the metrics may take a while.