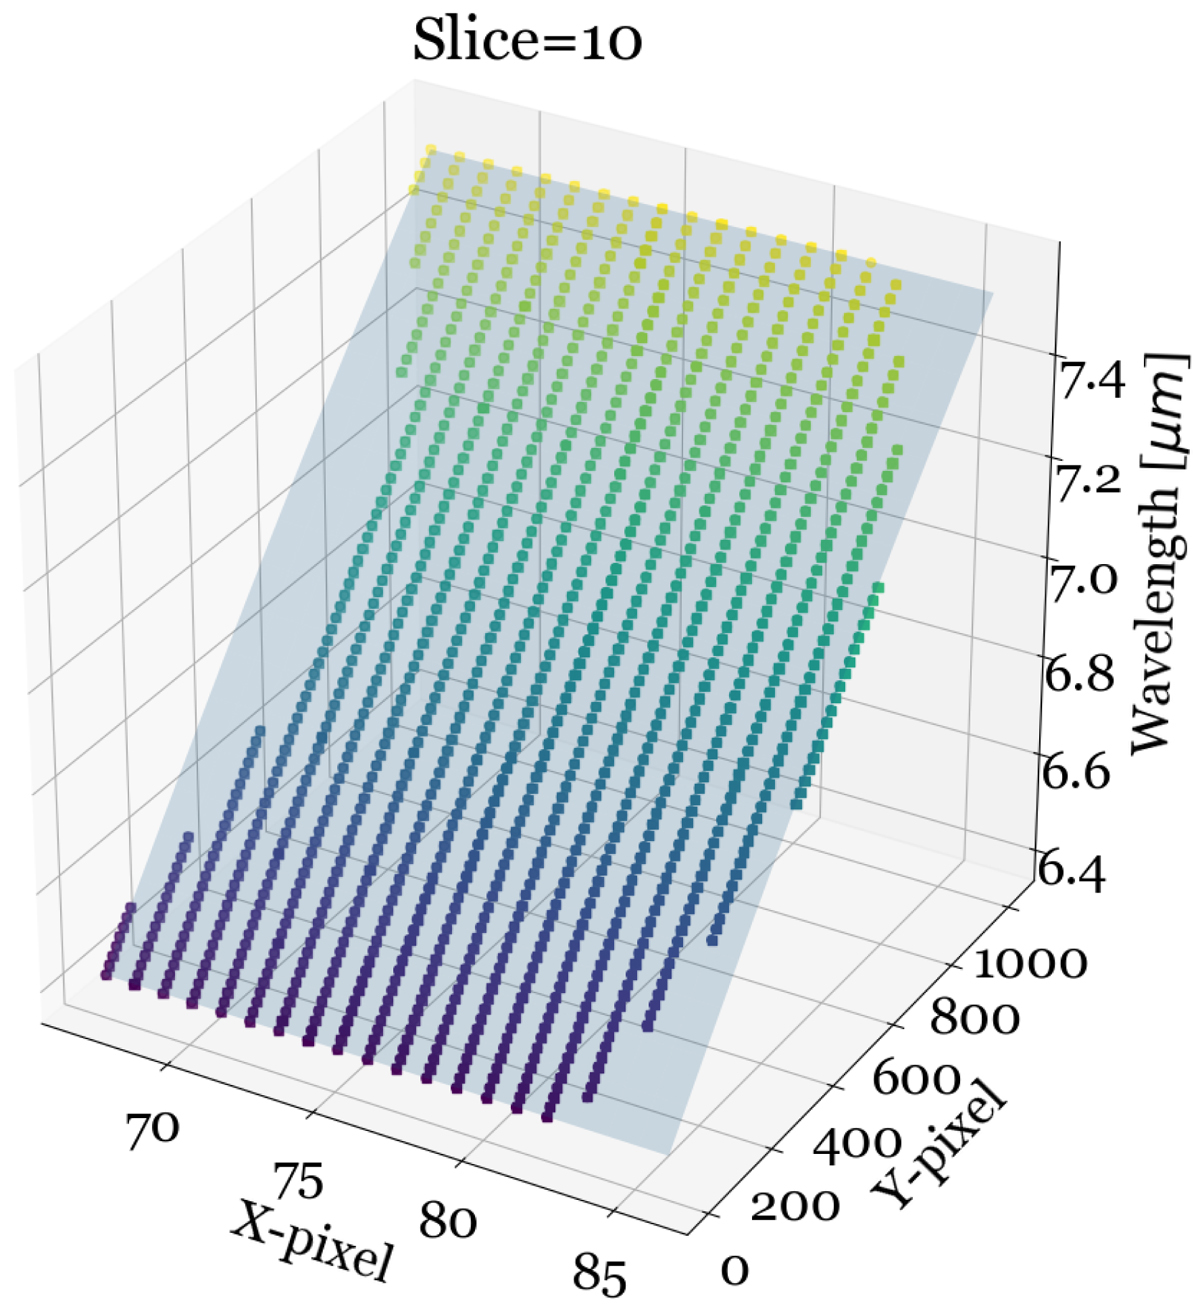
Fig. 7.
Download original image
2D polynomial fit of the ET1 line centroids in slice 10 of MRS sub-band 1C. The scatter points show the ET1 centroids fitted on the detector (x, y) pixel space. The respective wavelength values matched using the FTS data are shown on the z-axis and in the color scale of the dots. The x and y axes show the respective pixel coordinates on the detector plane. The light blue plane shows the fitted 2D polynomial.
Current usage metrics show cumulative count of Article Views (full-text article views including HTML views, PDF and ePub downloads, according to the available data) and Abstracts Views on Vision4Press platform.
Data correspond to usage on the plateform after 2015. The current usage metrics is available 48-96 hours after online publication and is updated daily on week days.
Initial download of the metrics may take a while.