Free Access
Fig. 4.
Download original image
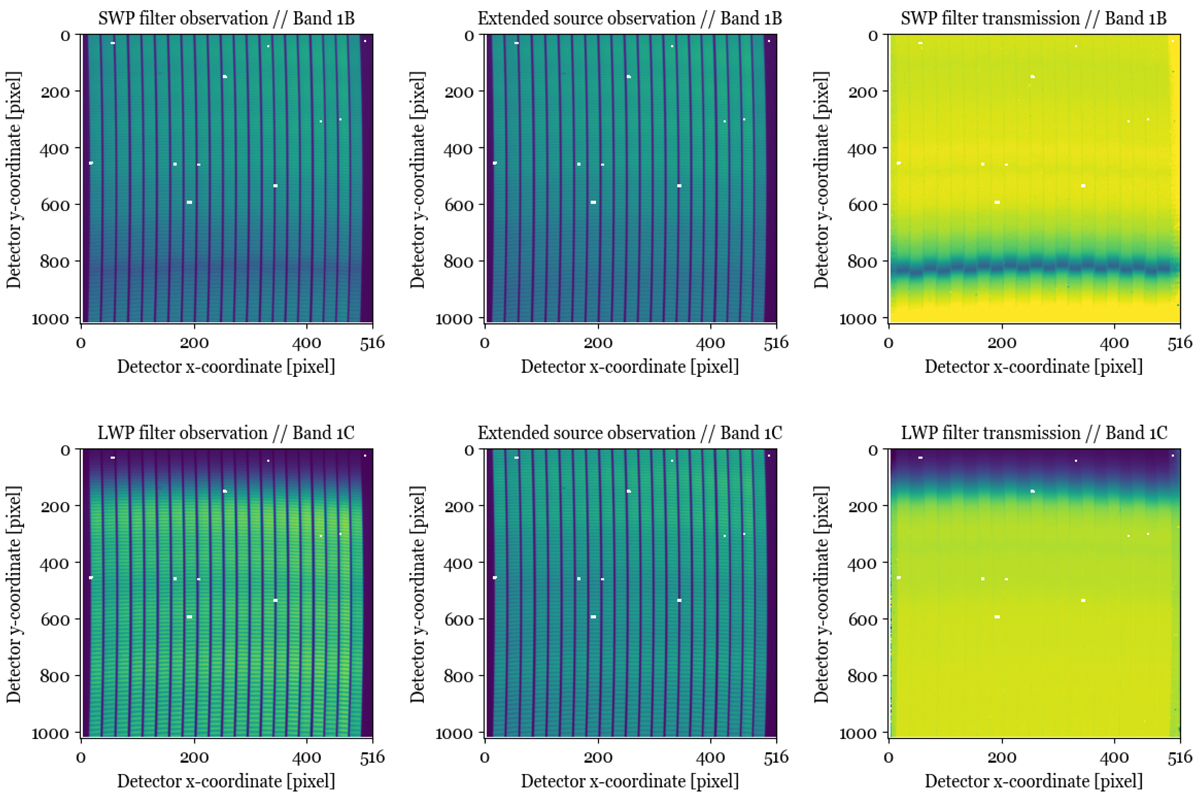
From left to right: observation of the MTS black body emission through the SWP (top) and LWP (bottom) filters, and with no MTS filter selected (center). The right panels show the division of the first (left) image by the second (center) image, producing a detector plane image of the wave pass filter throughput curves.
Current usage metrics show cumulative count of Article Views (full-text article views including HTML views, PDF and ePub downloads, according to the available data) and Abstracts Views on Vision4Press platform.
Data correspond to usage on the plateform after 2015. The current usage metrics is available 48-96 hours after online publication and is updated daily on week days.
Initial download of the metrics may take a while.