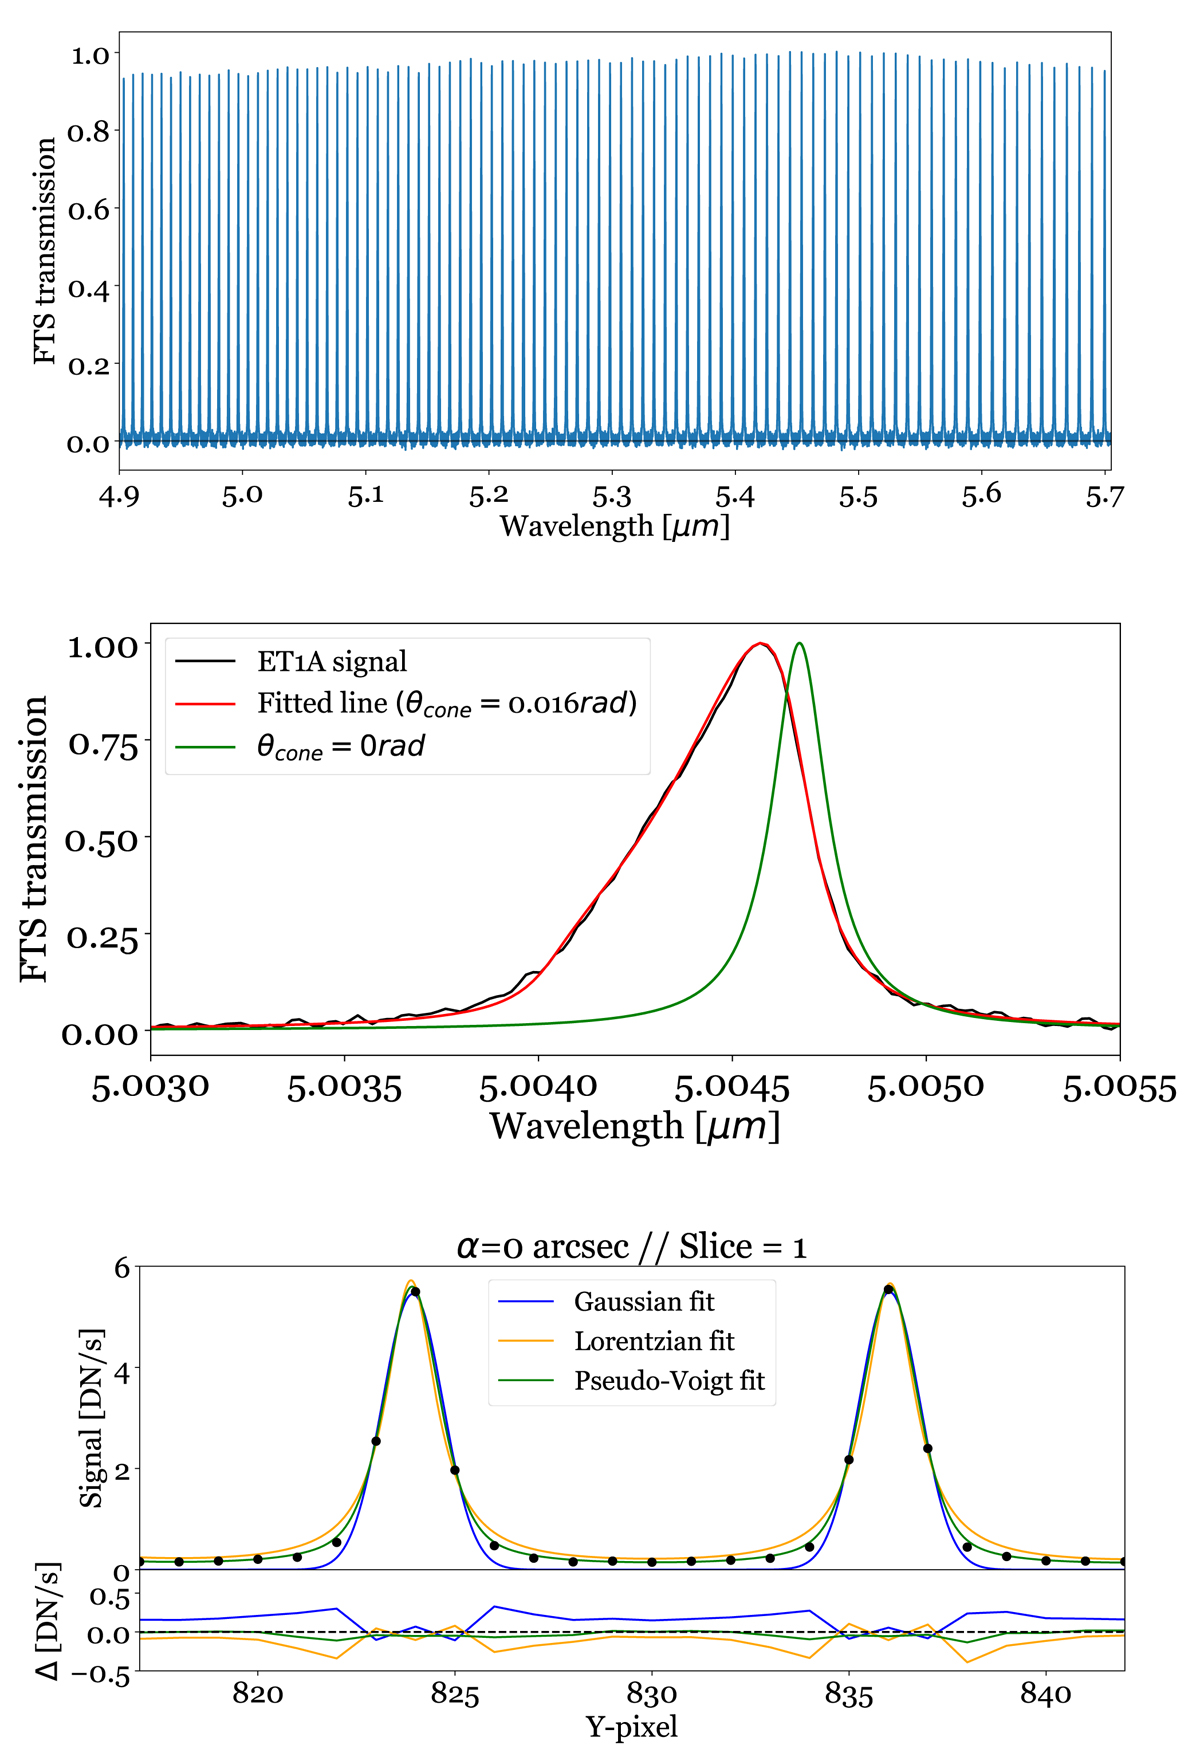
Fig. 3.
Download original image
Top: transmission of ET1 measured with the FTS for the wavelength range of MRS band 1A (FTS data), before mounting it on the MTS for the MIRI test campaigns. Multiple well-separated (unblended) resonance lines can be seen. Middle: fit of a single etalon line in the ET1 FTS data (black profile). The line shape in the data is impacted by the nonzero divergence angle of the beam (deviation from a perfectly collimated beam), and it shows up as here as the asymmetry of the line. We accounted for this in the fit (see Sect. 2), as shown by the red profile. The green profile shows the same etalon line if the beam was perfectly collimated (Eqs. (5) and (6)). Bottom: fit of different line profiles from the (MTS mounted) ET1 etalon, as observed with the MRS (black points), and residuals of the fits computed by subtracting the fitted model from the data. The MTS+MIRI setup is not affected by collimation issues. Its spectral resolution, as expected, is clearly lower than in the FTS measurements.
Current usage metrics show cumulative count of Article Views (full-text article views including HTML views, PDF and ePub downloads, according to the available data) and Abstracts Views on Vision4Press platform.
Data correspond to usage on the plateform after 2015. The current usage metrics is available 48-96 hours after online publication and is updated daily on week days.
Initial download of the metrics may take a while.