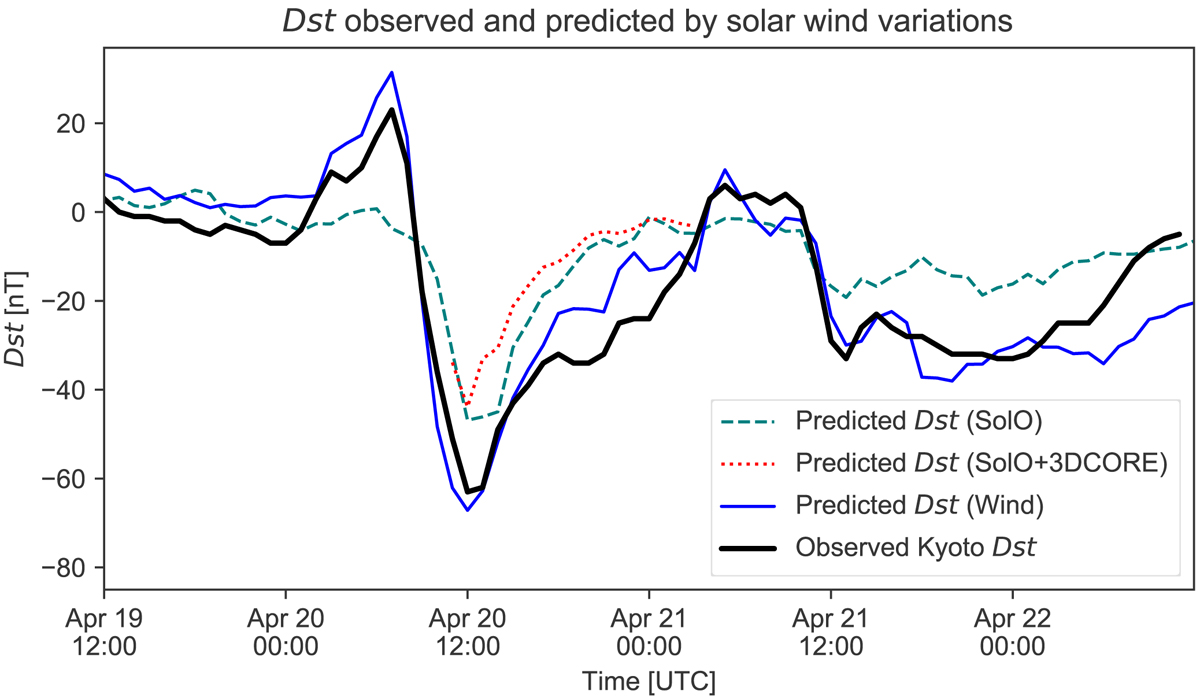
Fig. 7.
Download original image
Prediction of Dst at Earth using Solar Orbiter data mapped to L1 under the assumption of a constant CME speed (339 km s−1). The solid black line shows the observed Kyoto Dst, the solid blue line the Dst predicted by the model using Wind data, while the dashed green line shows the Dst that would have been predicted using a forecast from Solar Orbiter. The dotted red line shows the results for the flux rope magnetic field taken from 3DCORE, which were used to predict the Dst resulting from the second half of the flux rope observed by Solar Orbiter.
Current usage metrics show cumulative count of Article Views (full-text article views including HTML views, PDF and ePub downloads, according to the available data) and Abstracts Views on Vision4Press platform.
Data correspond to usage on the plateform after 2015. The current usage metrics is available 48-96 hours after online publication and is updated daily on week days.
Initial download of the metrics may take a while.