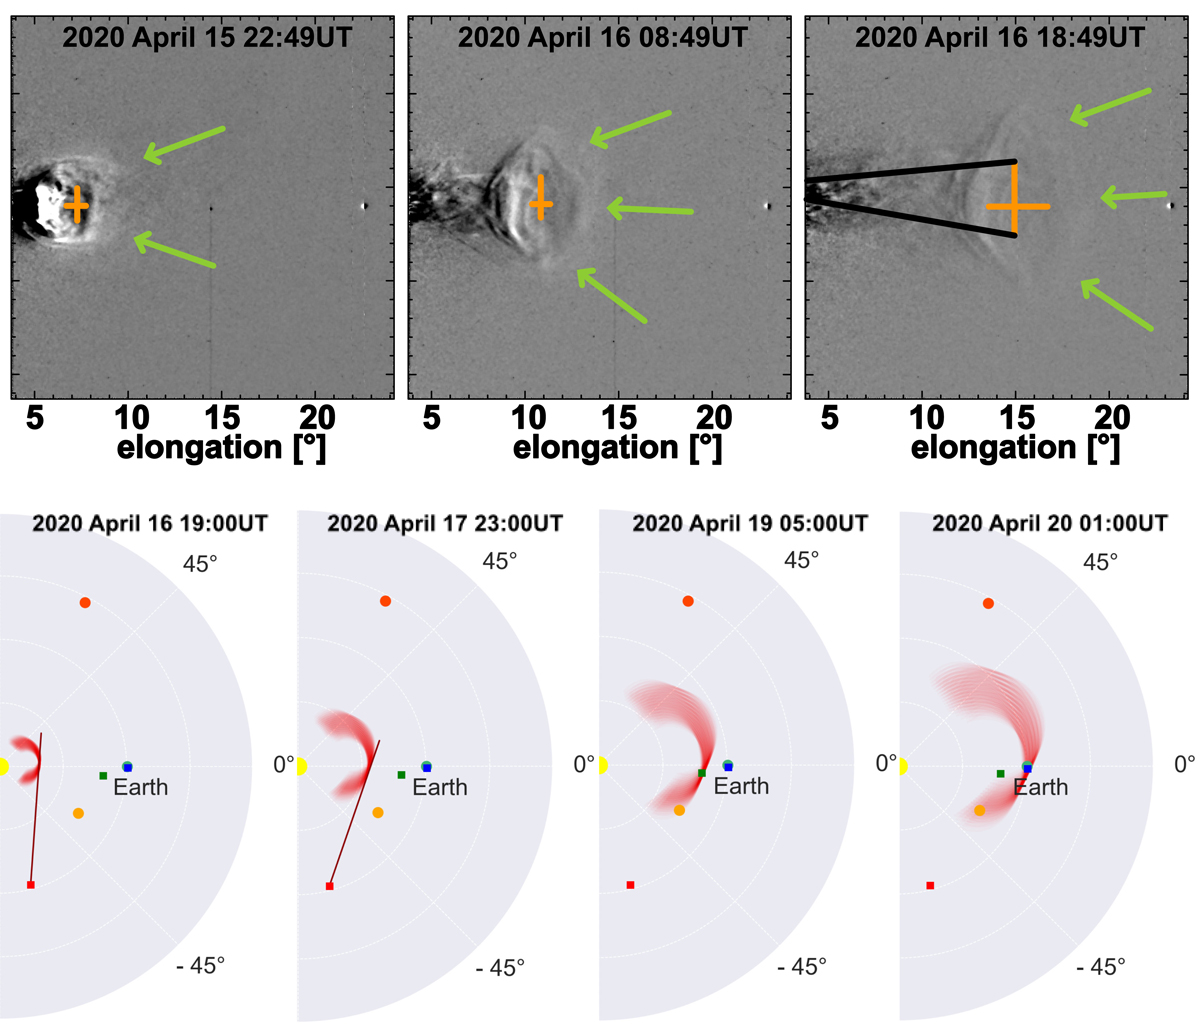
Fig. 2.
Download original image
Evolution of the CME in STEREO-A HI1. Upper three panels: running difference images of the CME, with green arrows indicating the CME leading edge. The ecliptic plane corresponds to the horizontal centre of the image, and the elongation angles marked on the x-axis pertain to the ecliptic. The orange crosses mark the extent of the cavity or void, the black lines indicate the angular width of the flux rope. Lower four panels: propagation of the CME leading edge in the ecliptic plane modelled with an ELEvoHI ensemble simulation, shown for different times, up to the impact of the CME at Solar Orbiter (green square) and Earth. The red tangent corresponds to the elongation measurements from HI.
Current usage metrics show cumulative count of Article Views (full-text article views including HTML views, PDF and ePub downloads, according to the available data) and Abstracts Views on Vision4Press platform.
Data correspond to usage on the plateform after 2015. The current usage metrics is available 48-96 hours after online publication and is updated daily on week days.
Initial download of the metrics may take a while.