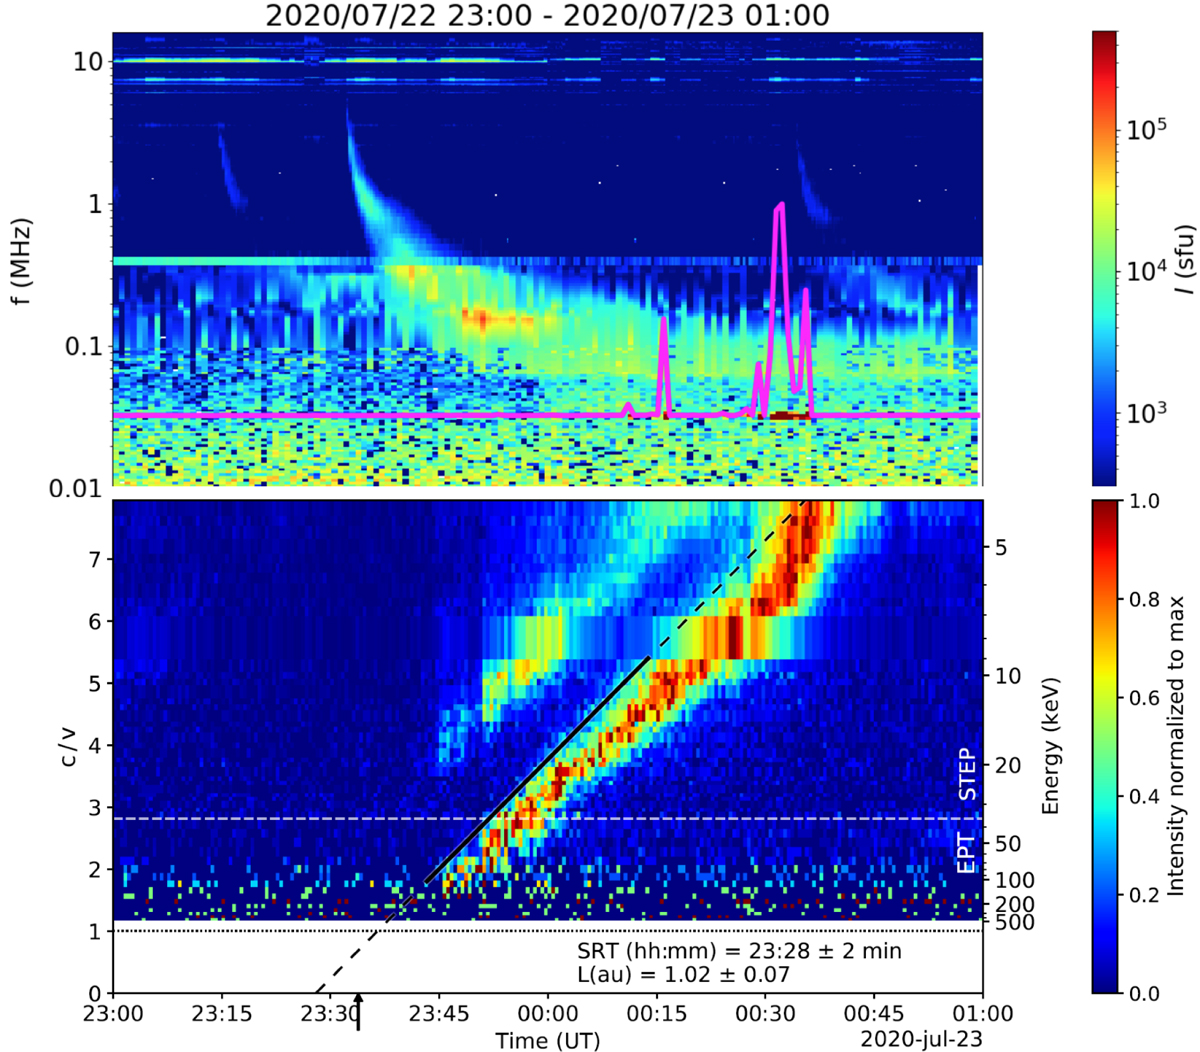
Fig. 3.

Download original image
Top: SolO/RPW radio dynamic spectrum observed in association with the electron event with an onset in late July 22. The magenta line is the spectral flux at the local plasma frequency, where the peaks indicate locally generated Langmuir waves. Bottom: electron c/v versus time plot. The color scale corresponds to the particle intensity, normalized to the maximum value for each energy (speed) channel. The black line is a linear fit to electron arrival times, indicating the solar particle release time. The energy interval used for the fit is marked with a solid line (see text for details).
Current usage metrics show cumulative count of Article Views (full-text article views including HTML views, PDF and ePub downloads, according to the available data) and Abstracts Views on Vision4Press platform.
Data correspond to usage on the plateform after 2015. The current usage metrics is available 48-96 hours after online publication and is updated daily on week days.
Initial download of the metrics may take a while.


