Fig. 2.

Download original image
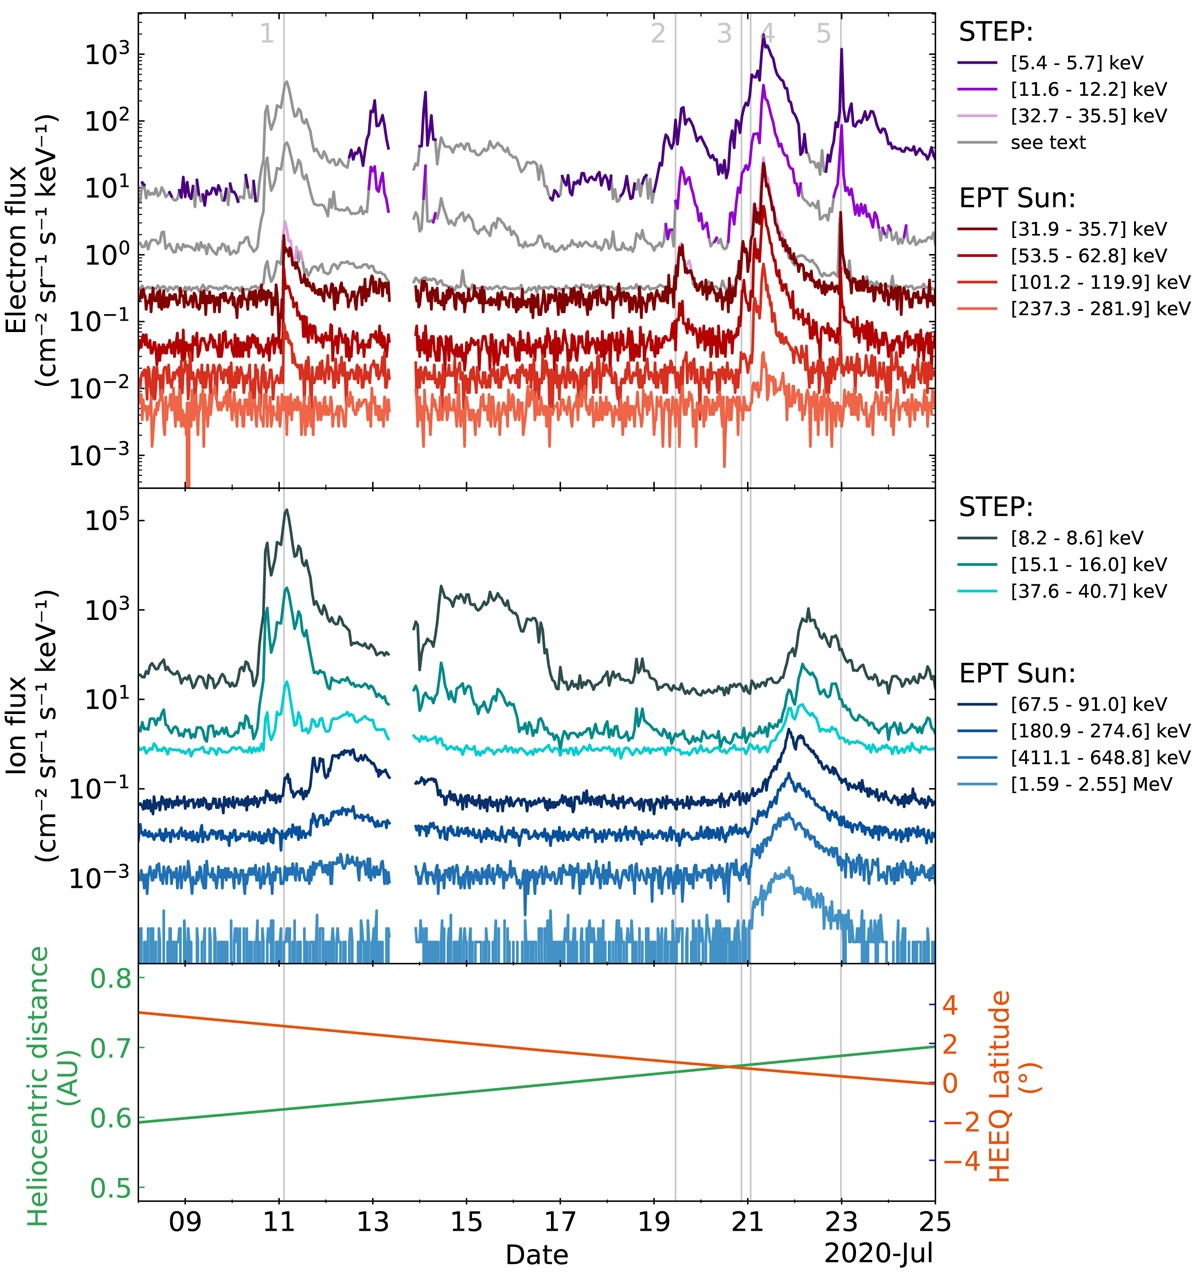
Summary of electron and ion observations by the EPD/EPT and EPD/STEP instruments during July 2020. From top to bottom: (1) electron time profiles at seven different energy channels; (2) ion time profiles at seven different energy channels; and (3) heliographic latitude and radial distance. Gray lines indicate time periods without clear electron measurements and should be interpreted as an upper limit for the electron flux. The STEP electron fluxes can have large uncertainties if an increased ion flux was observed at the same time. Vertical lines mark the onset times of the five NR-electron enhancements listed in Table 1.
Current usage metrics show cumulative count of Article Views (full-text article views including HTML views, PDF and ePub downloads, according to the available data) and Abstracts Views on Vision4Press platform.
Data correspond to usage on the plateform after 2015. The current usage metrics is available 48-96 hours after online publication and is updated daily on week days.
Initial download of the metrics may take a while.


