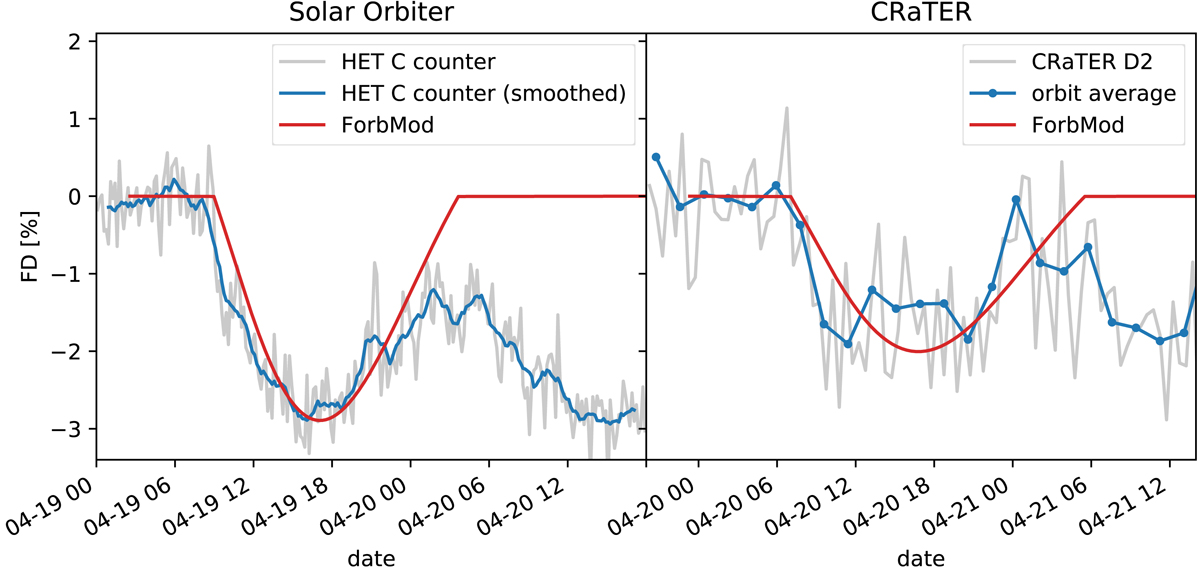
Fig. 9.
Download original image
ForbMod model results at Solar Orbiter and CRaTER, in comparison with the measured Forbush decreases at Solar Orbiter and CRaTER. The measurements are plotted in the same fashion as in Figs. 4 and 5, but normalized to their pre-onset values to reflect the relative variation of the GCR count rate. Input parameters for ForbMod are listed in Tables 3 and 4. Also, na and nB were used from the “best fit” result.
Current usage metrics show cumulative count of Article Views (full-text article views including HTML views, PDF and ePub downloads, according to the available data) and Abstracts Views on Vision4Press platform.
Data correspond to usage on the plateform after 2015. The current usage metrics is available 48-96 hours after online publication and is updated daily on week days.
Initial download of the metrics may take a while.