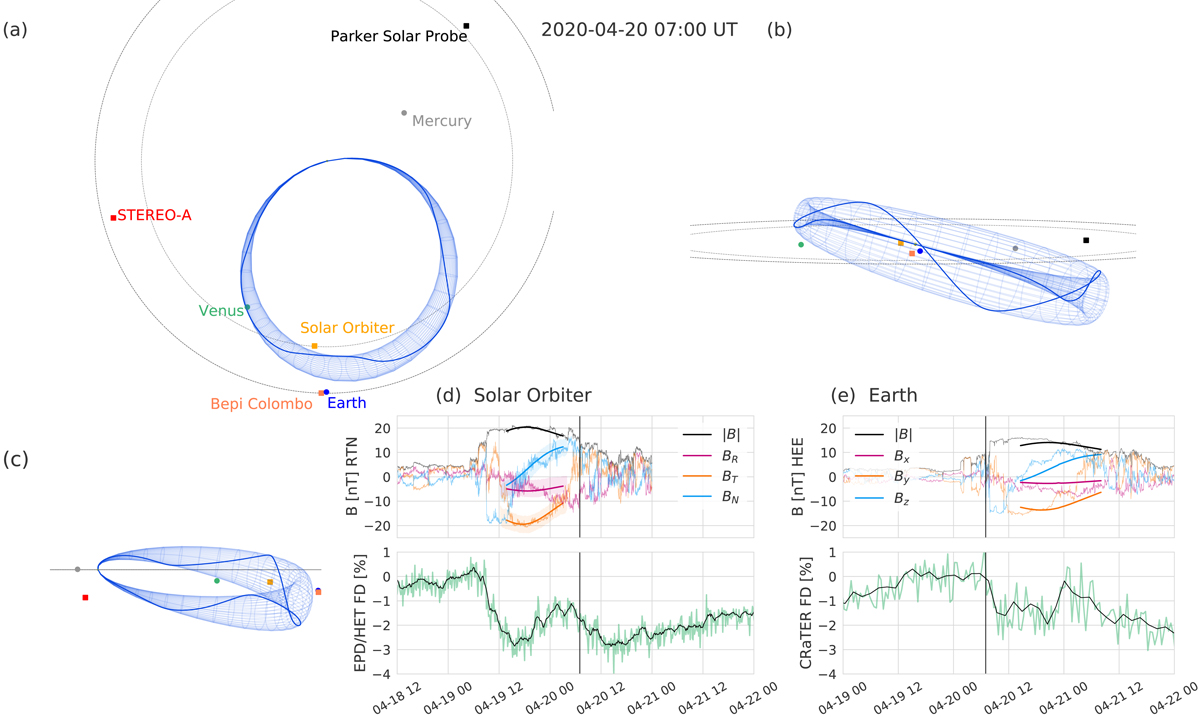
Fig. 7.
Download original image
Visualization of the results of the 3DCORE flux rope model fitted to the Solar Orbiter MAG observations, shown at the time of the onset of the Forbush decrease at Earth. The reconstructed 3D flux rope structure is shown: (a) looking down from the solar north pole onto the solar equatorial plane, (b) in a frontal view along the Sun–Earth line, and (c) in a side view at a 75 degree angle, the longitude of STEREO–A to Earth. A flux rope field line is highlighted as a solid blue line. Panels d and e: in situ magnetic field data from Solar Orbiter and Wind at Earth/L1 compared to the GCR variation as a percentage drop in the amplitude measured by EPD/HET and CRaTER. The Wind magnetic field components are given here in Heliocentric Earth Ecliptic (HEE) coordinates, as in Fig. 5. The 3DCORE modeled magnetic field is overplotted in panel d and propagated to Earth as shown in (e). An animation of this figure is available as an online movie.
Current usage metrics show cumulative count of Article Views (full-text article views including HTML views, PDF and ePub downloads, according to the available data) and Abstracts Views on Vision4Press platform.
Data correspond to usage on the plateform after 2015. The current usage metrics is available 48-96 hours after online publication and is updated daily on week days.
Initial download of the metrics may take a while.