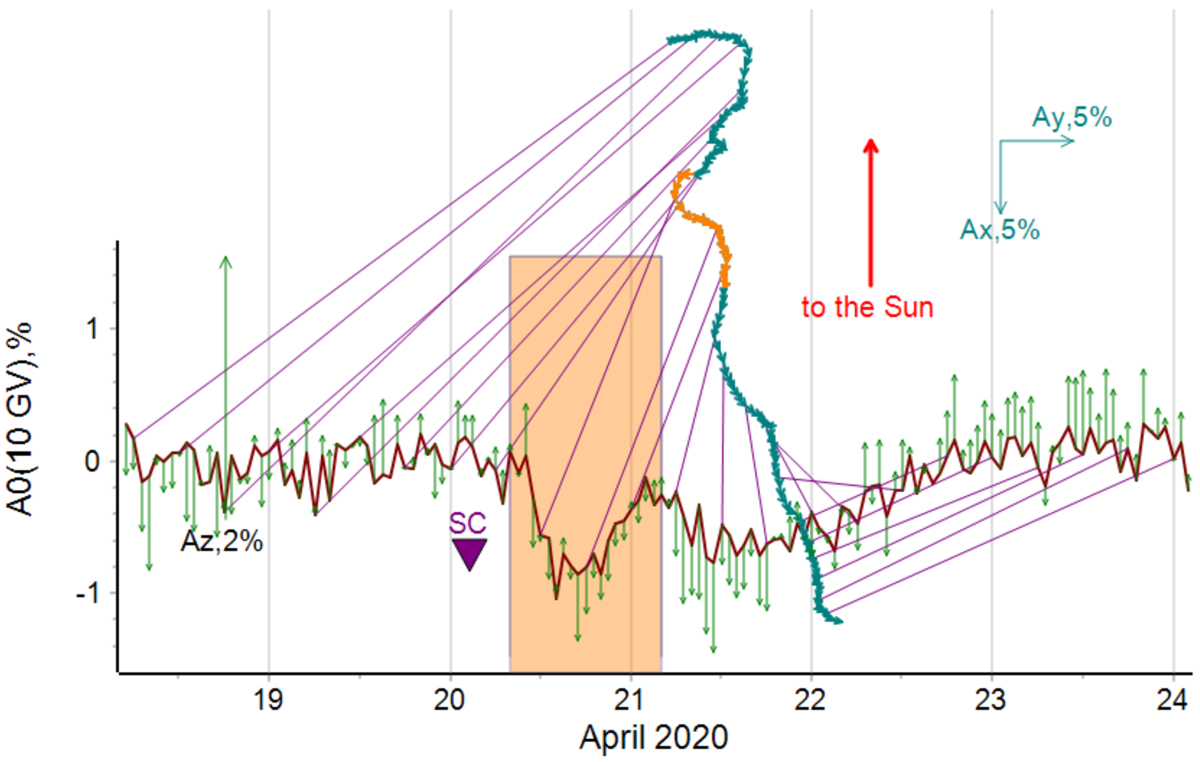
Fig. 6.
Download original image
GCR density variation A0 at Earth obtained from GSM at a fixed rigidity of 10 GV (brown line, corresponding to 9.1 GeV proton energy), together with the first harmonic of the cosmic ray anisotropy. The equatorial component Axy of the anisotropy is displayed as a vector diagram (teal and orange triangles), which are connected to the corresponding points in time on the A0 plot with magenta lines. Additionally, the north-south component Az is shown as green vertical arrows on top of A0 time profile. The shaded rectangle and the orange part of the vector diagram correspond to the duration of the magnetic cloud (MC). The shock arrival at Earth is indicated by the arrow labeled SC (“sudden storm commencement”), and the direction to the Sun in the vector diagram is indicated with a red arrow. The components of the anisotropy Ax and Ay that define the plane for the calculation of Axy are indicated on the top right corner of the figure. Numbers at each anisotropy component on the figure indicate the scale used for the plotting of the relevant arrows.
Current usage metrics show cumulative count of Article Views (full-text article views including HTML views, PDF and ePub downloads, according to the available data) and Abstracts Views on Vision4Press platform.
Data correspond to usage on the plateform after 2015. The current usage metrics is available 48-96 hours after online publication and is updated daily on week days.
Initial download of the metrics may take a while.