Fig. 5.
Download original image
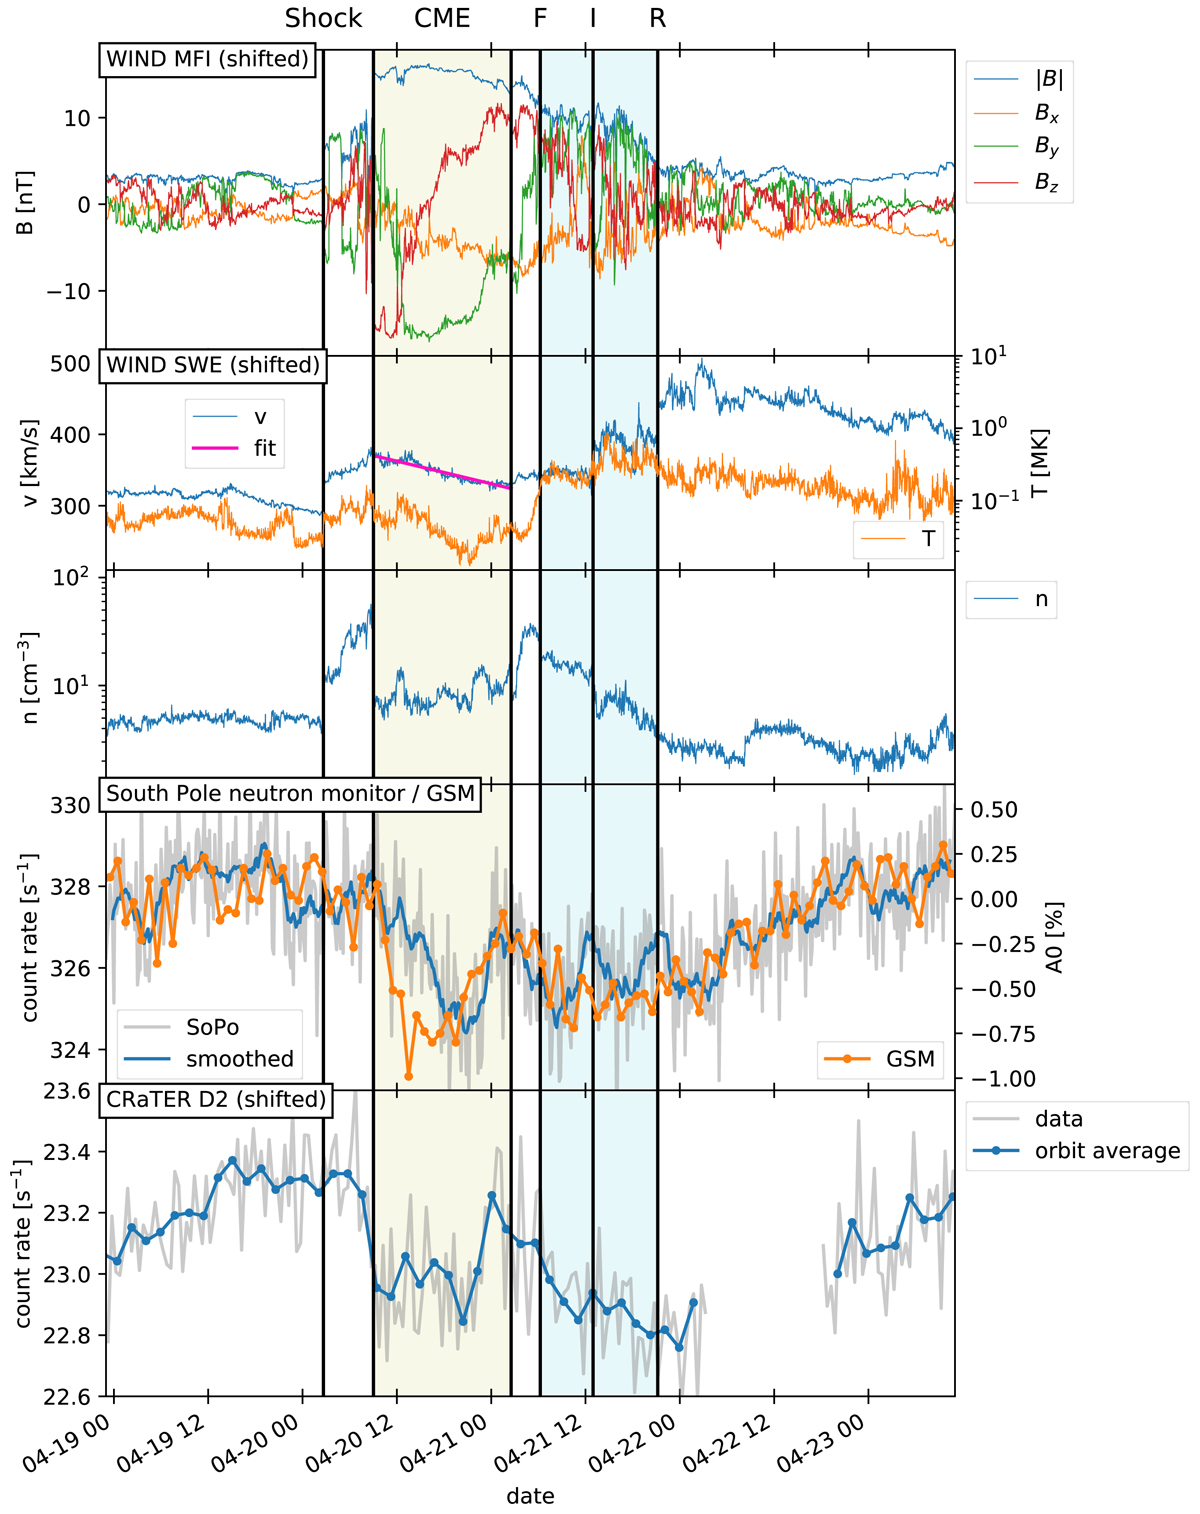
Measurements near Earth from MFI and SWE on Wind and neutron monitors on Earth as well as the CRaTER D2 counter, showing the in situ signatures of the CME and the associated FD, as well as a high speed stream following afterwards. Wind data were shifted forward in time by 1 h and 7 min to account for the expected transit time between the L1 Lagrange point and Earth, and CRaTER data were shifted by 15 min, corresponding to the Moon–Earth radial distance. Black vertical lines and shaded regions mark the time periods corresponding to different events: shock arrival, CME start and end, as well as forward shock (F), stream interface (I), and reverse shock (R) of the SIR. Wind MFI measurements are given in Heliocentric Earth Ecliptic (HEE) coordinates, with X pointing from the Sun to Earth and Z being perpendicular to the ecliptic pointing north, and Y completing the right handed triad. The general orientation of HEE is thus comparable to RTN, which is used for SolO data in Fig. 4, and the difference to RTN is small. A linear fit to the velocity profile of the flux rope, which is used to determine the expansion speed as explained by Gulisano et al. (2012), is shown in pink. The second panel from the bottom shows both measurements from the south pole neutron monitor (gray, blue) and the GCR density variation at 10 GV (corresponding to 9.1 GeV proton energy) obtained from GSM.
Current usage metrics show cumulative count of Article Views (full-text article views including HTML views, PDF and ePub downloads, according to the available data) and Abstracts Views on Vision4Press platform.
Data correspond to usage on the plateform after 2015. The current usage metrics is available 48-96 hours after online publication and is updated daily on week days.
Initial download of the metrics may take a while.