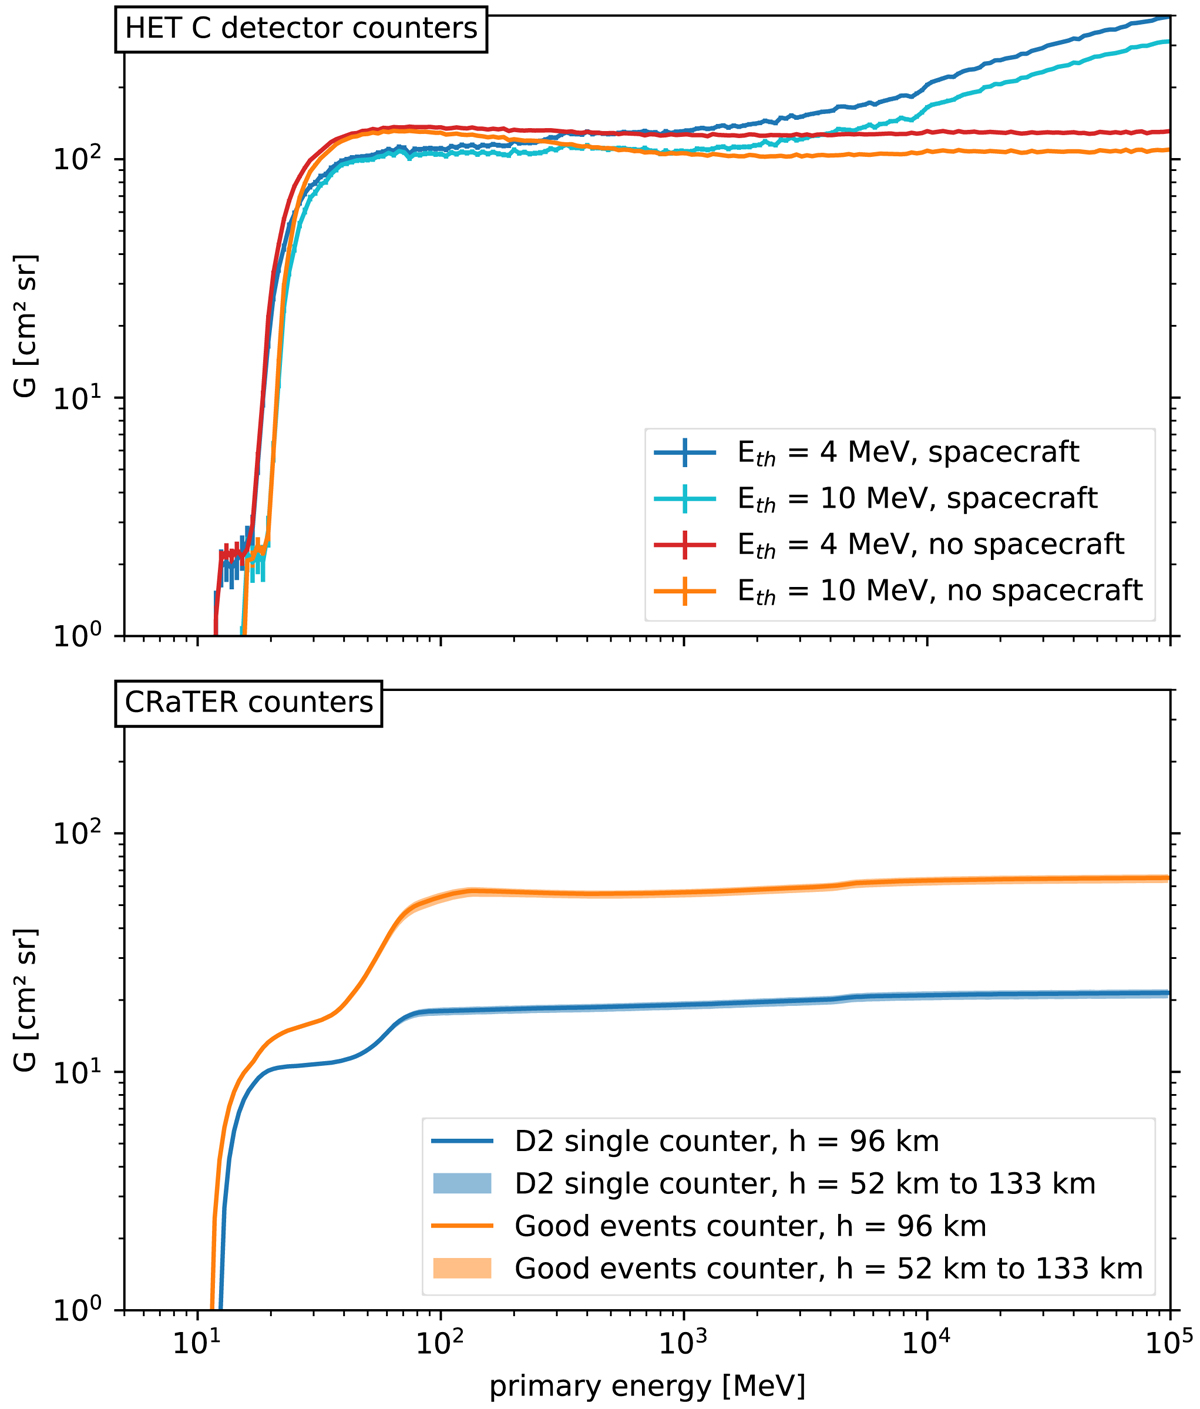
Fig. 3.
Download original image
Response functions (i.e. energy-dependent geometric factors) of the SolO HET and LRO CRaTER detectors employed to measure FDs in this study. Upper panel: HET C detector single counters. The four lines correspond to four different scenarios depending on the threshold applied for the available counters. The derivation of the response function using a Geant4 simulation is described in Sect. 2.1. Lower panel: D2 detector single counter (blue) and good events counter (orange) of CRaTER. Lines show the response for the mean altitude of CRaTER during the event, while shaded areas mark the range of responses for the maximum and minimum altitudes. These response functions were derived by Looper et al. (2013) and are described in Sect. 2.2.
Current usage metrics show cumulative count of Article Views (full-text article views including HTML views, PDF and ePub downloads, according to the available data) and Abstracts Views on Vision4Press platform.
Data correspond to usage on the plateform after 2015. The current usage metrics is available 48-96 hours after online publication and is updated daily on week days.
Initial download of the metrics may take a while.