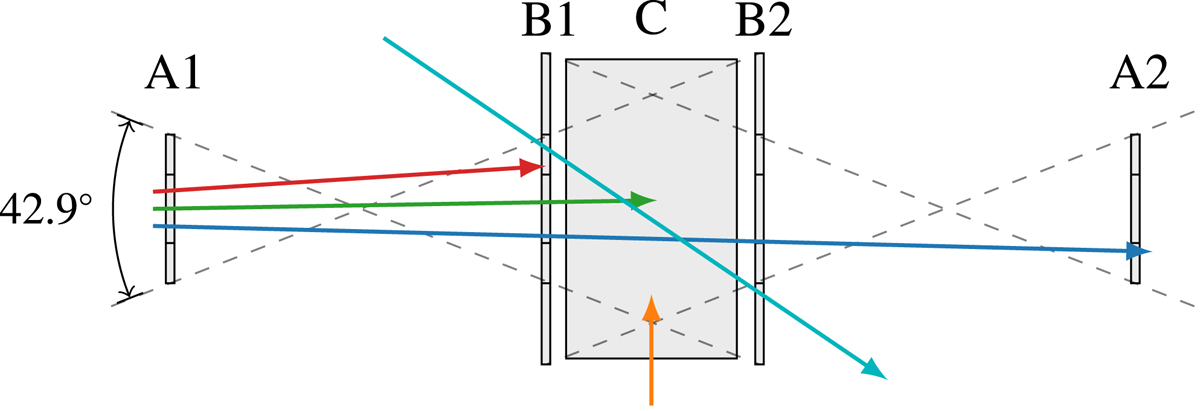
Fig. 2.
Download original image
Schematic diagram of the HET sensor head. Exemplary particle trajectories ending up in different data products are shown by the arrows: stopping in B (red), stopping in C (green), penetrating (blue), GCR channel (aquamarine), C single counter (orange). A 3D graphic of the sensor head is shown in Rodríguez-Pacheco et al. (2020, Fig. 31).
Current usage metrics show cumulative count of Article Views (full-text article views including HTML views, PDF and ePub downloads, according to the available data) and Abstracts Views on Vision4Press platform.
Data correspond to usage on the plateform after 2015. The current usage metrics is available 48-96 hours after online publication and is updated daily on week days.
Initial download of the metrics may take a while.