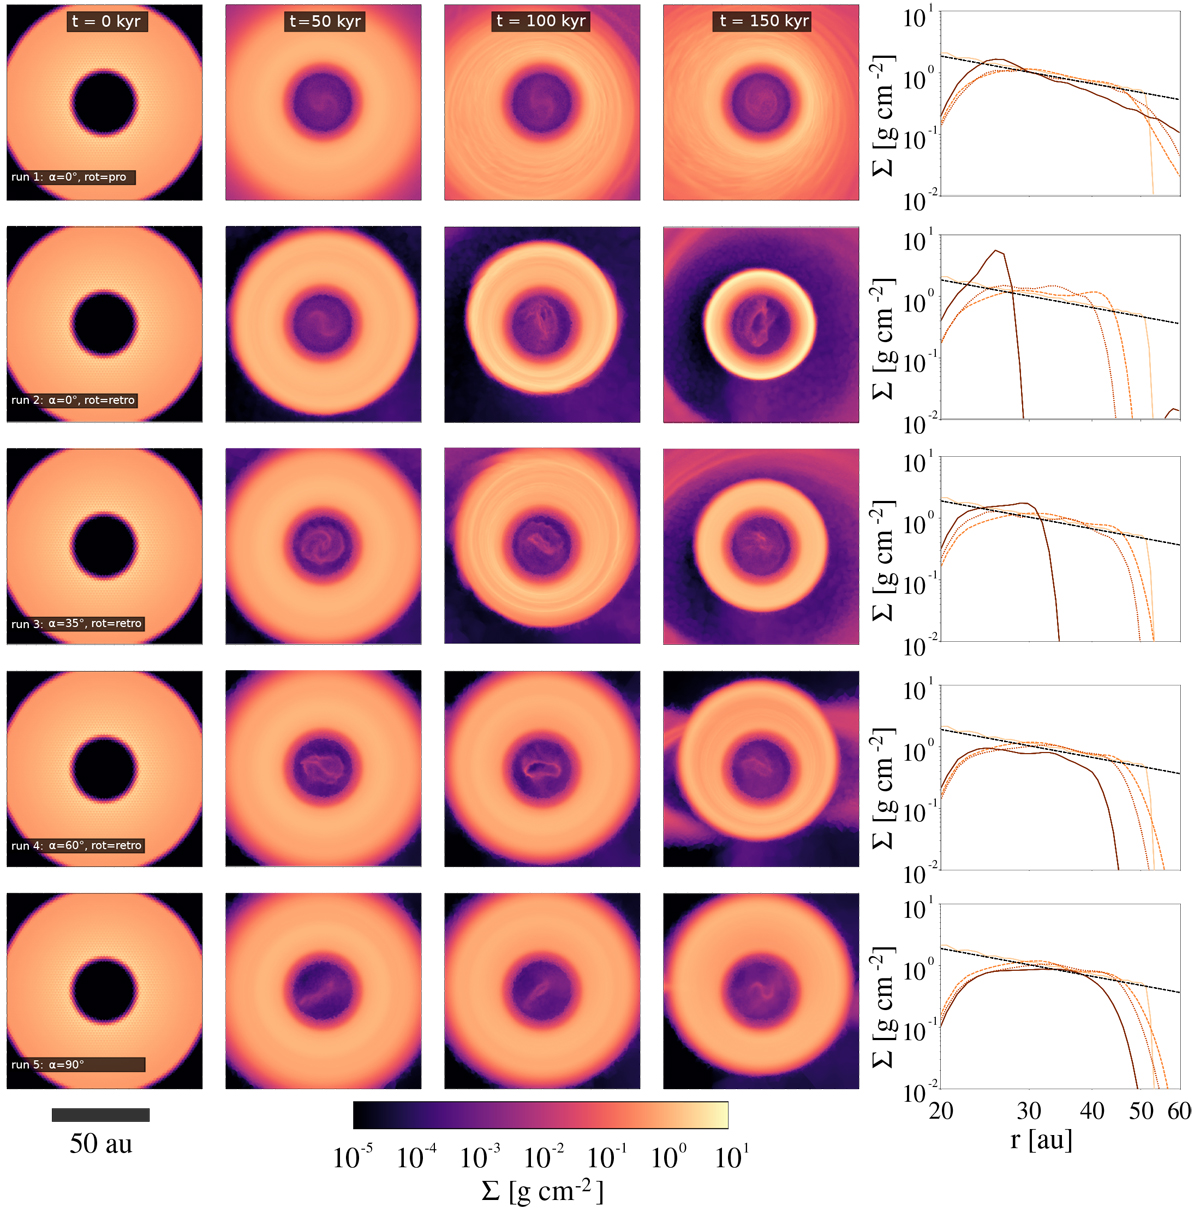
Fig. 5
Download original image
Projection of the inner disk for runs 1 to 5 (top to bottom) at t = 0, 50, 100, and 150 kyr (from left to right) measured perpendicular to the initial plane of the inner disk and azimuthally averaged column density profile at the shown snapshots (rightmost panels). The azimuthally averaged column density in the rightmost panels was computed within a vertical extent of z = ±6 AU and the darkness of the line corresponds to the time of evolution (from light orange representing t = 0 kyr to dark orange at the end of the simulation). We note that the inner part is affected by accretion onto thecentral star and gravitational softening. We therefore exclude the inner region within r = racc + 5 AU = rgrav,soft + 10 au = 20 AU in the azimuthally averaged column density profiles.
Current usage metrics show cumulative count of Article Views (full-text article views including HTML views, PDF and ePub downloads, according to the available data) and Abstracts Views on Vision4Press platform.
Data correspond to usage on the plateform after 2015. The current usage metrics is available 48-96 hours after online publication and is updated daily on week days.
Initial download of the metrics may take a while.