Fig. 7
Download original image
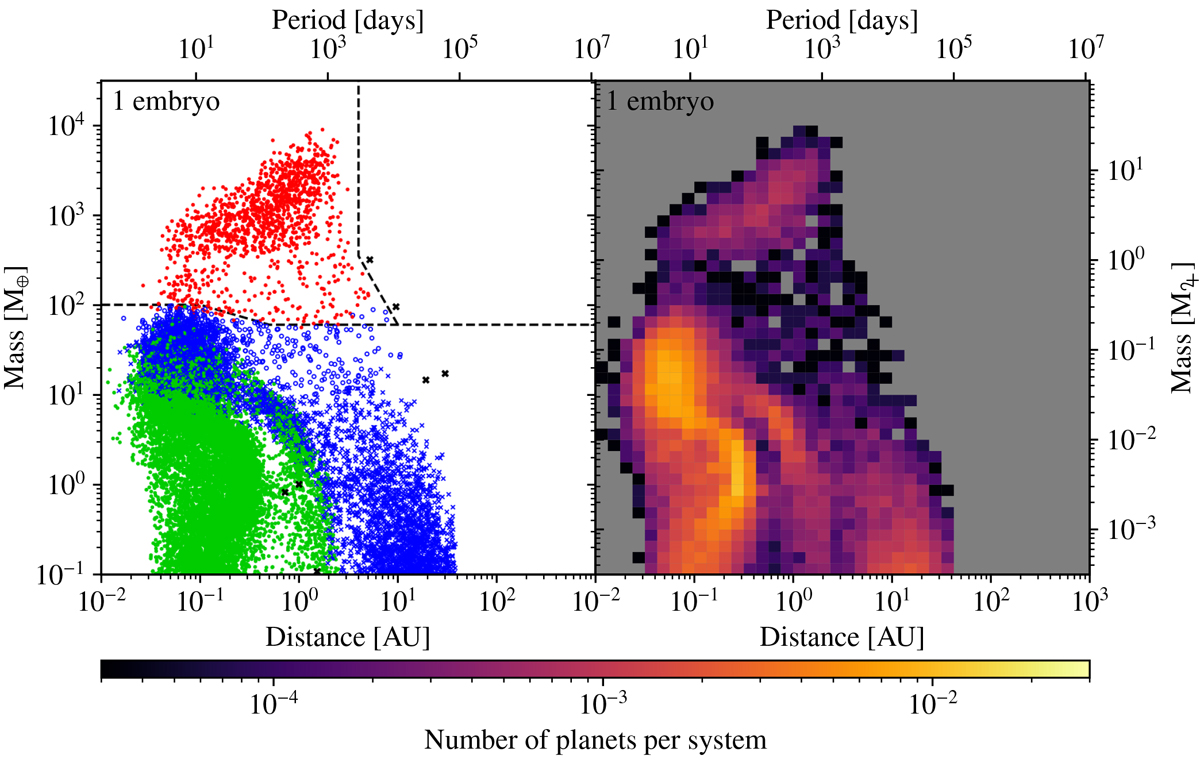
Mass-distance diagram (left) and the corresponding histogram (right) for the population with a single embryo per system.The colours and shapes of the symbols show the bulk composition: Red points are giant planets with Menv ∕Mcore > 1. Blue symbols are planets that have accreted more than 1% by mass of volatile material (ices) from beyond the ice line(s). The remainder of the planets are shown by green circles. Open green and blue circles have 0.1 ≤ Menv∕Mcore ≤ 1 while filled green points and blue crosses have Menv∕Mcore ≤ 0.1. Black crosses show the Solar system planets. The dashed black line highlights the change of planet regime (from core-dominated, blue, to envelope-dominated, red) at 100 M⊕ inside 0.1 au to 60 M⊕ beyond 0.5 au. The vertical dashed line shows the outer limit for giant planets (4 au above 350 M⊕ to 10 au at 60 au).
Current usage metrics show cumulative count of Article Views (full-text article views including HTML views, PDF and ePub downloads, according to the available data) and Abstracts Views on Vision4Press platform.
Data correspond to usage on the plateform after 2015. The current usage metrics is available 48-96 hours after online publication and is updated daily on week days.
Initial download of the metrics may take a while.