Fig. 6
Download original image
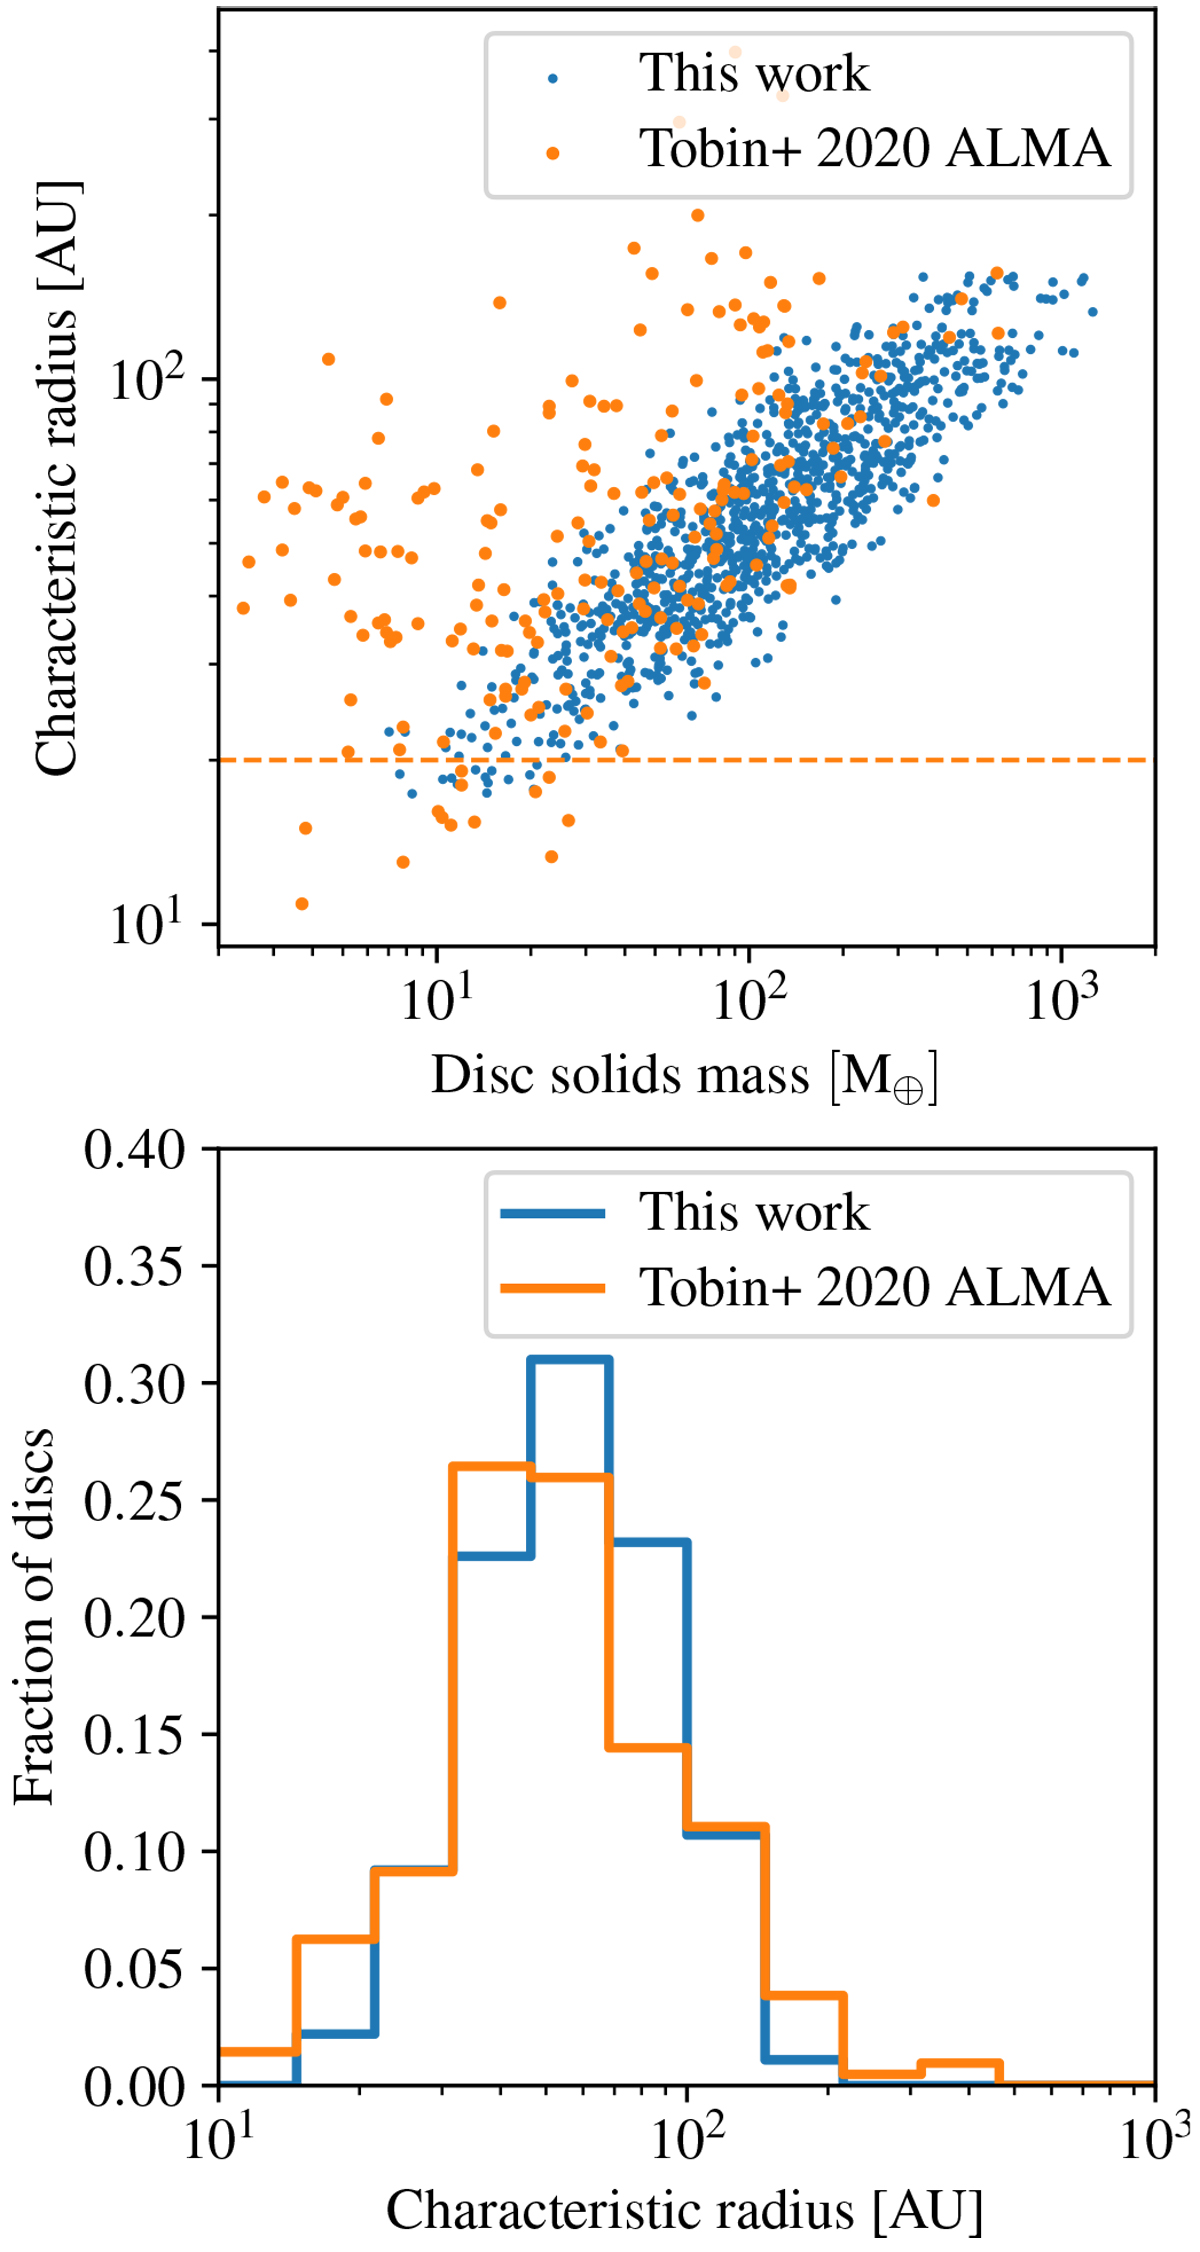
Comparison of characteristic initial gas disc radii versus disc masses (top) and disc radii alone (bottom) between this work (in blue) and the observational results for Class 0/I/flat spectrum dust discs of non-multiple protostars using ALMA (Tobin et al. 2020, in orange). The dashed orange line represents half the typical spatial resolution of the survey.
Current usage metrics show cumulative count of Article Views (full-text article views including HTML views, PDF and ePub downloads, according to the available data) and Abstracts Views on Vision4Press platform.
Data correspond to usage on the plateform after 2015. The current usage metrics is available 48-96 hours after online publication and is updated daily on week days.
Initial download of the metrics may take a while.