Fig. 5
Download original image
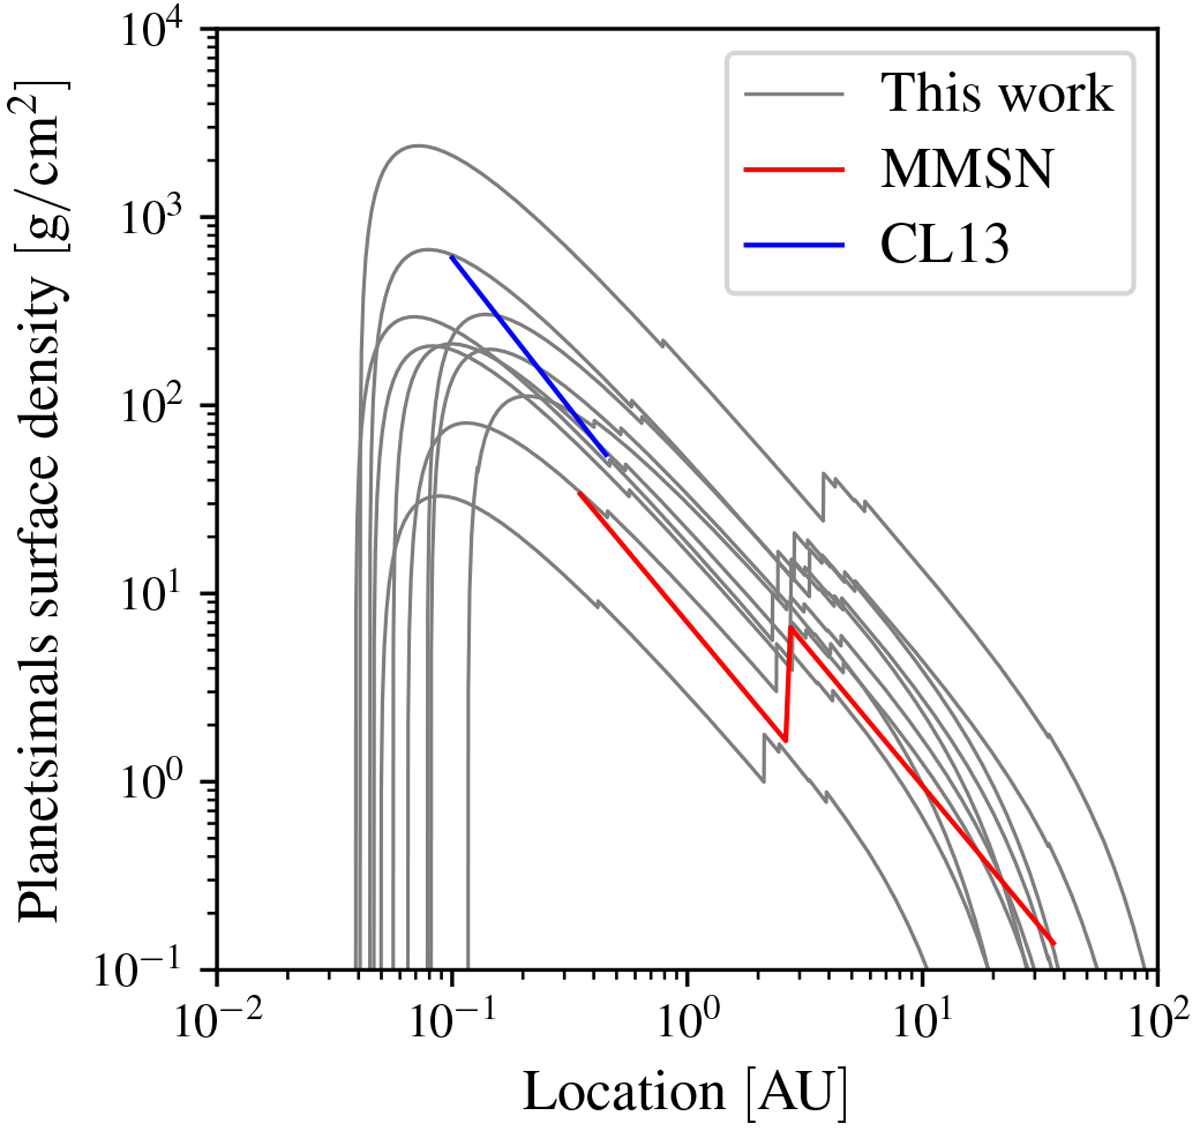
Initial planetesimals surface density profiles for 10 discs, which were selected using the quantiles of the disc mass distribution,to be representative of the entire population. The top and bottom grey lines thus show the most and least massive disc. The red line is the minimum-mass solar nebula (MMSN, Weidenschilling 1977; Hayashi 1981), while the blue line is the minimum-mass extrasolar nebula (Chiang & Laughlin 2013, CL13).
Current usage metrics show cumulative count of Article Views (full-text article views including HTML views, PDF and ePub downloads, according to the available data) and Abstracts Views on Vision4Press platform.
Data correspond to usage on the plateform after 2015. The current usage metrics is available 48-96 hours after online publication and is updated daily on week days.
Initial download of the metrics may take a while.