Fig. A.1
Download original image
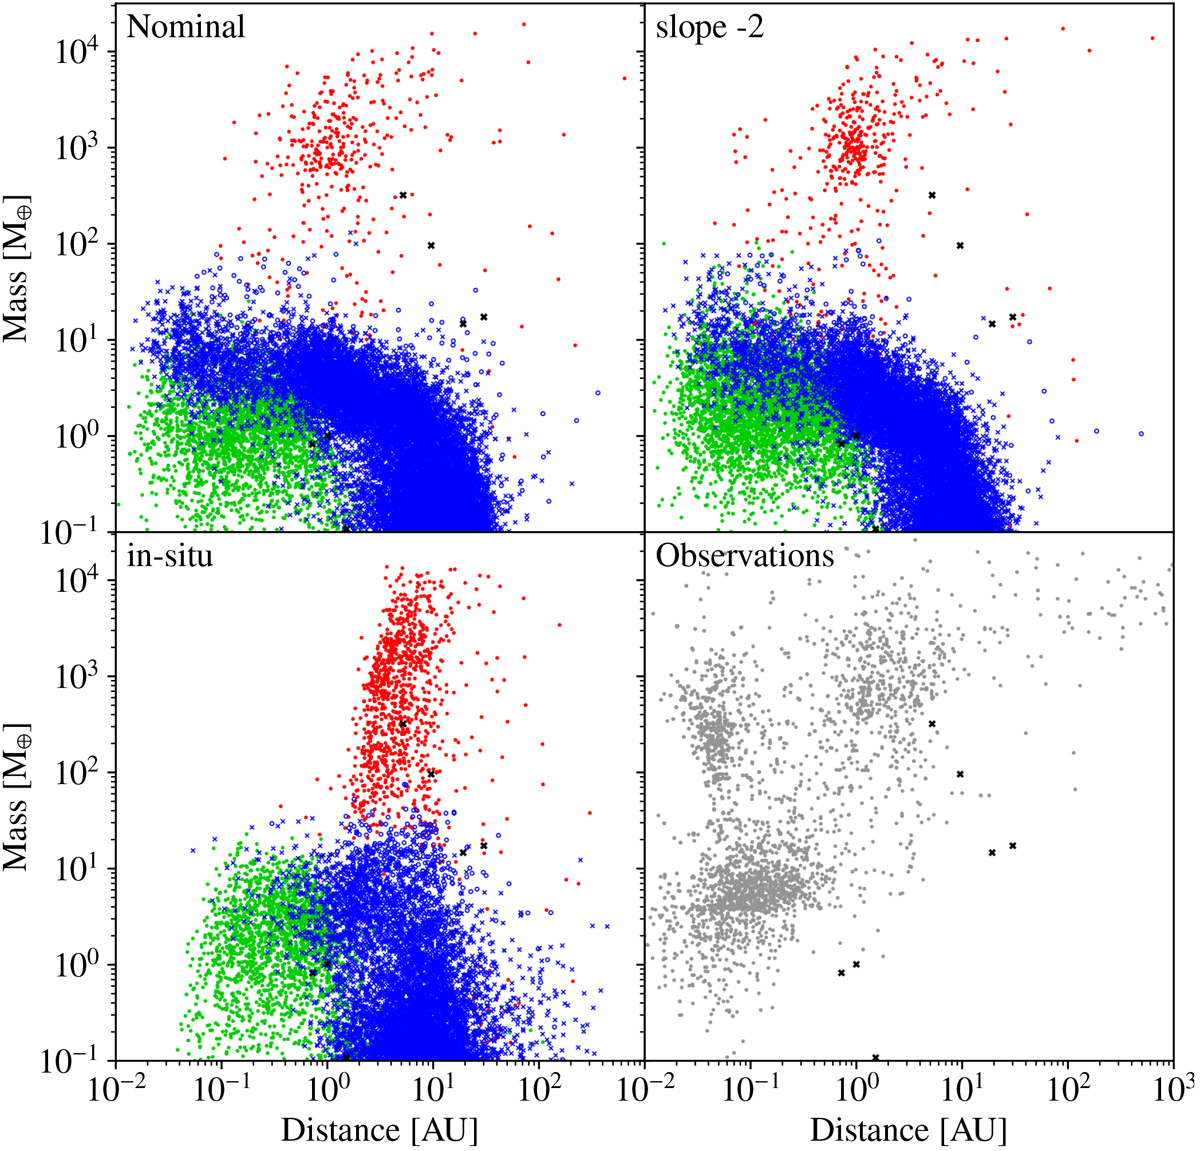
Mass-distance diagram for the comparison of 100 embryos populations generated with different model parameters. The upper left panel shows the nominal population, the upper right panel shows one where the index of the power law for the initial distribution of solids was changed to βs = 2 (so that the isolation mass is constant with distance), while the lower left panel shows a population where no gas-driven migration is included. The bottom right panel shows the known exoplanets as of 18 June 2021. It should be noted that this does not account for detection biases, which favour the discovery of hot-Jupiters. This gives the incorrect impression that the model severely fails to reproduce those planets.
Current usage metrics show cumulative count of Article Views (full-text article views including HTML views, PDF and ePub downloads, according to the available data) and Abstracts Views on Vision4Press platform.
Data correspond to usage on the plateform after 2015. The current usage metrics is available 48-96 hours after online publication and is updated daily on week days.
Initial download of the metrics may take a while.