Open Access
Fig. 25
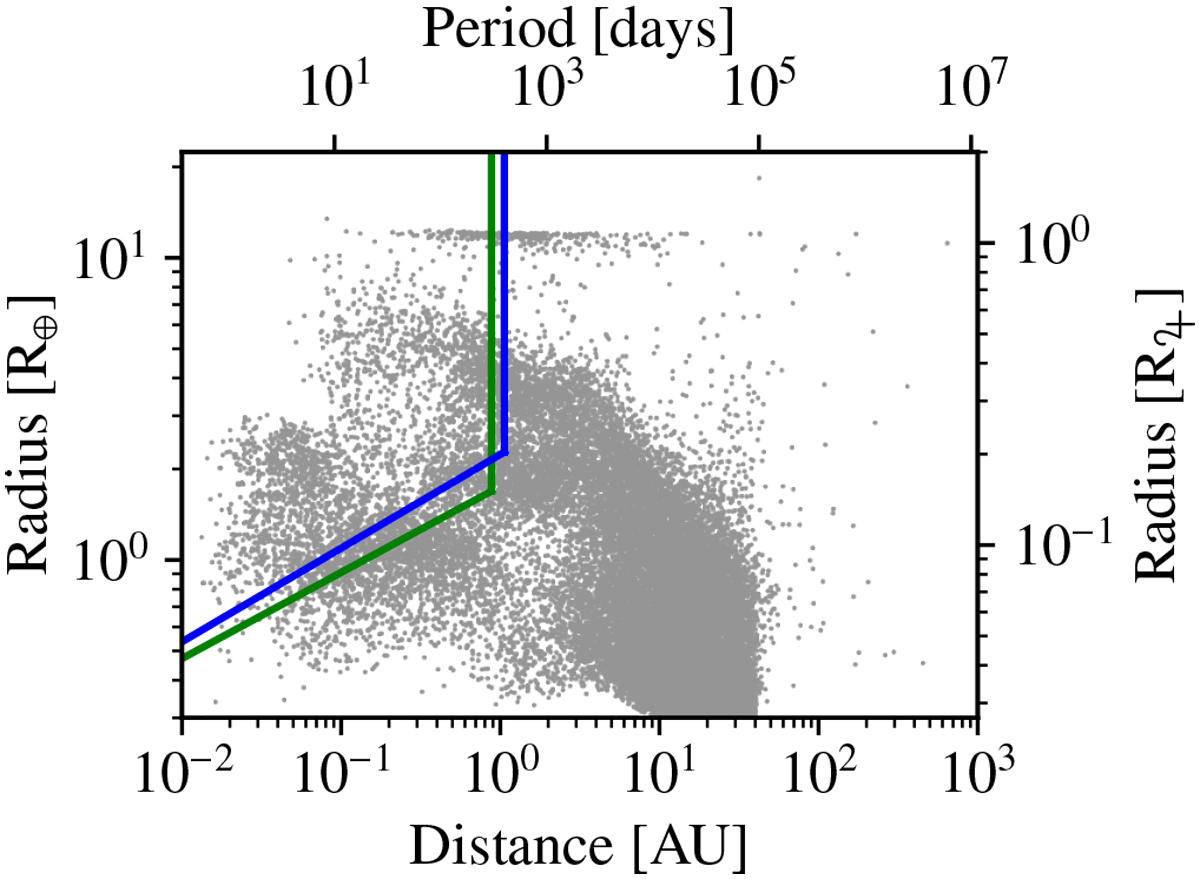
Download original image
Radius-distance diagram of the population with 100 embryos per system overlaid with two Kepler-related categories. The green line shows the criterion following Petigura et al. (2018), while the blue line shows the criterion following Zhu et al. (2018).
Current usage metrics show cumulative count of Article Views (full-text article views including HTML views, PDF and ePub downloads, according to the available data) and Abstracts Views on Vision4Press platform.
Data correspond to usage on the plateform after 2015. The current usage metrics is available 48-96 hours after online publication and is updated daily on week days.
Initial download of the metrics may take a while.