Fig. 24
Download original image
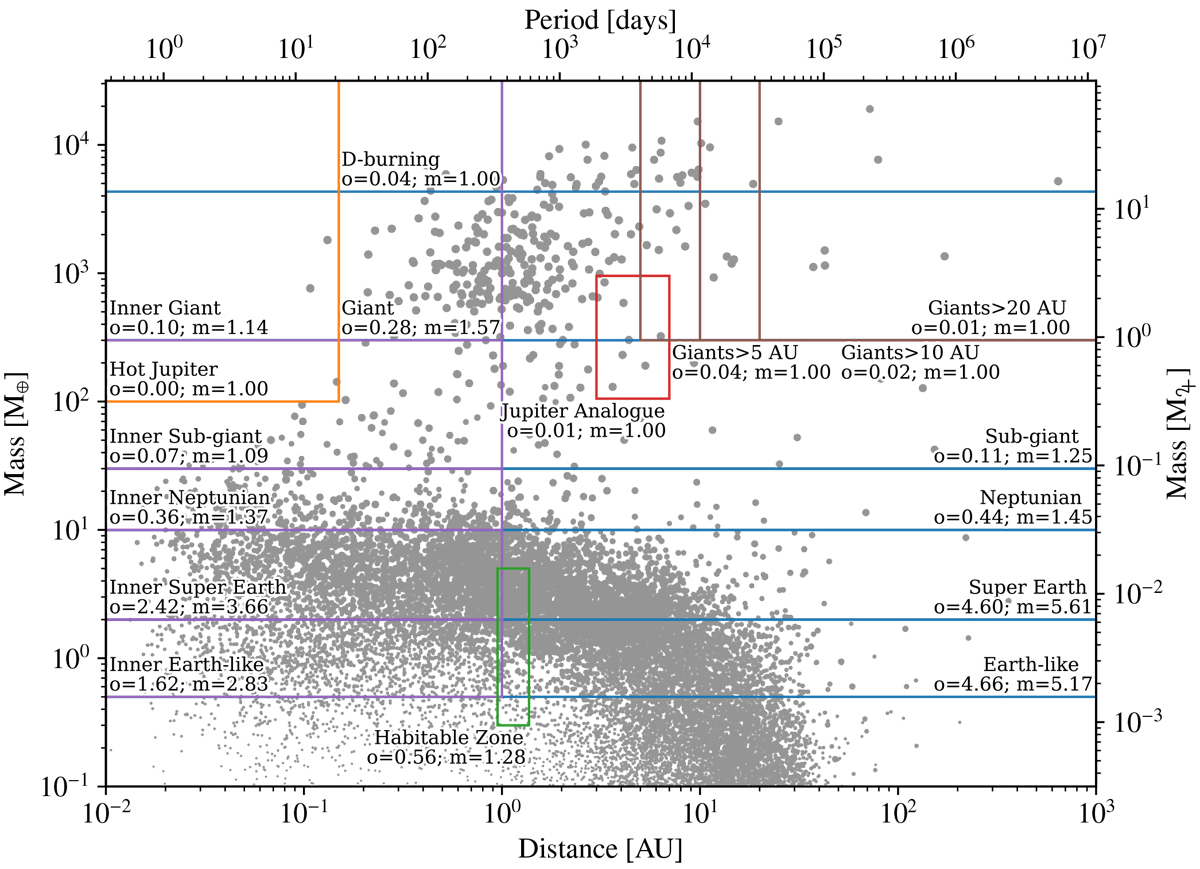
Mass-distance diagram of the population with 100 embryos per system overlaid with the different planet categories. The point size is related to the logarithm of the planet’s physical size. The different categories provided in Table 6 have their boundaries marked, and the principal characteristics of the planets falling within each category are repeated: o denotes the occurrence rate and m the multiplicity.
Current usage metrics show cumulative count of Article Views (full-text article views including HTML views, PDF and ePub downloads, according to the available data) and Abstracts Views on Vision4Press platform.
Data correspond to usage on the plateform after 2015. The current usage metrics is available 48-96 hours after online publication and is updated daily on week days.
Initial download of the metrics may take a while.