Fig. 18
Download original image
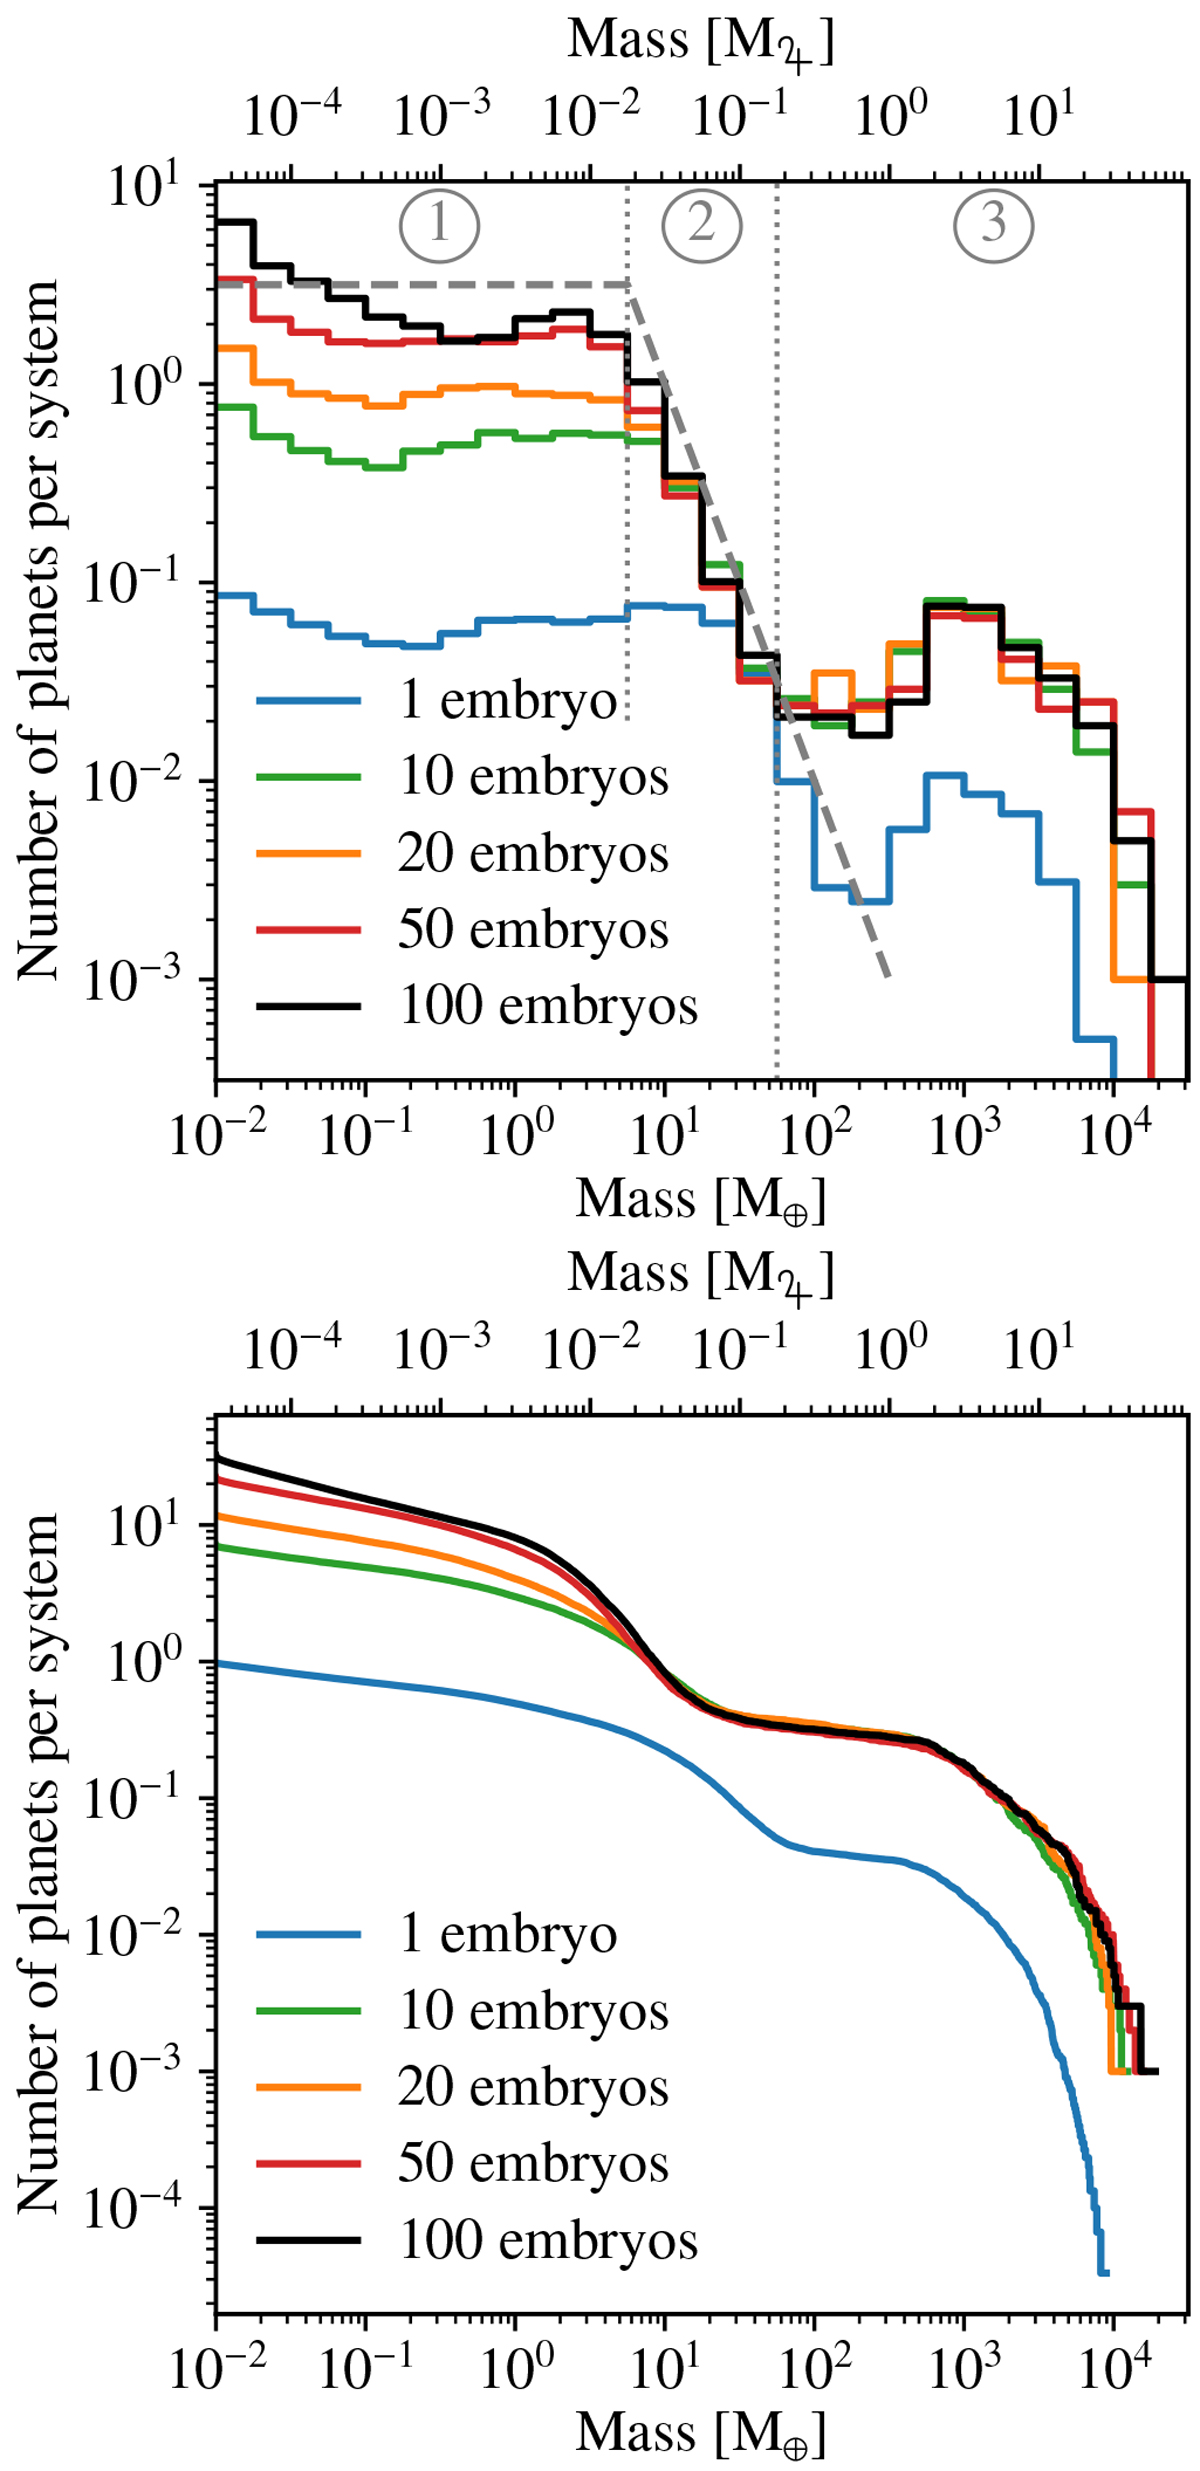
Histogram (top) and reverse cumulative distribution (bottom) of the planet masses for the four populations presented in this study. The values are normalised by the number of systems in each population. Only planets that reached the end of the formation stage are counted; the maximum number of planets per system (the top left ending of the cumulative curves) can then be lower than the initial number of embryos.
Current usage metrics show cumulative count of Article Views (full-text article views including HTML views, PDF and ePub downloads, according to the available data) and Abstracts Views on Vision4Press platform.
Data correspond to usage on the plateform after 2015. The current usage metrics is available 48-96 hours after online publication and is updated daily on week days.
Initial download of the metrics may take a while.