Fig. 17
Download original image
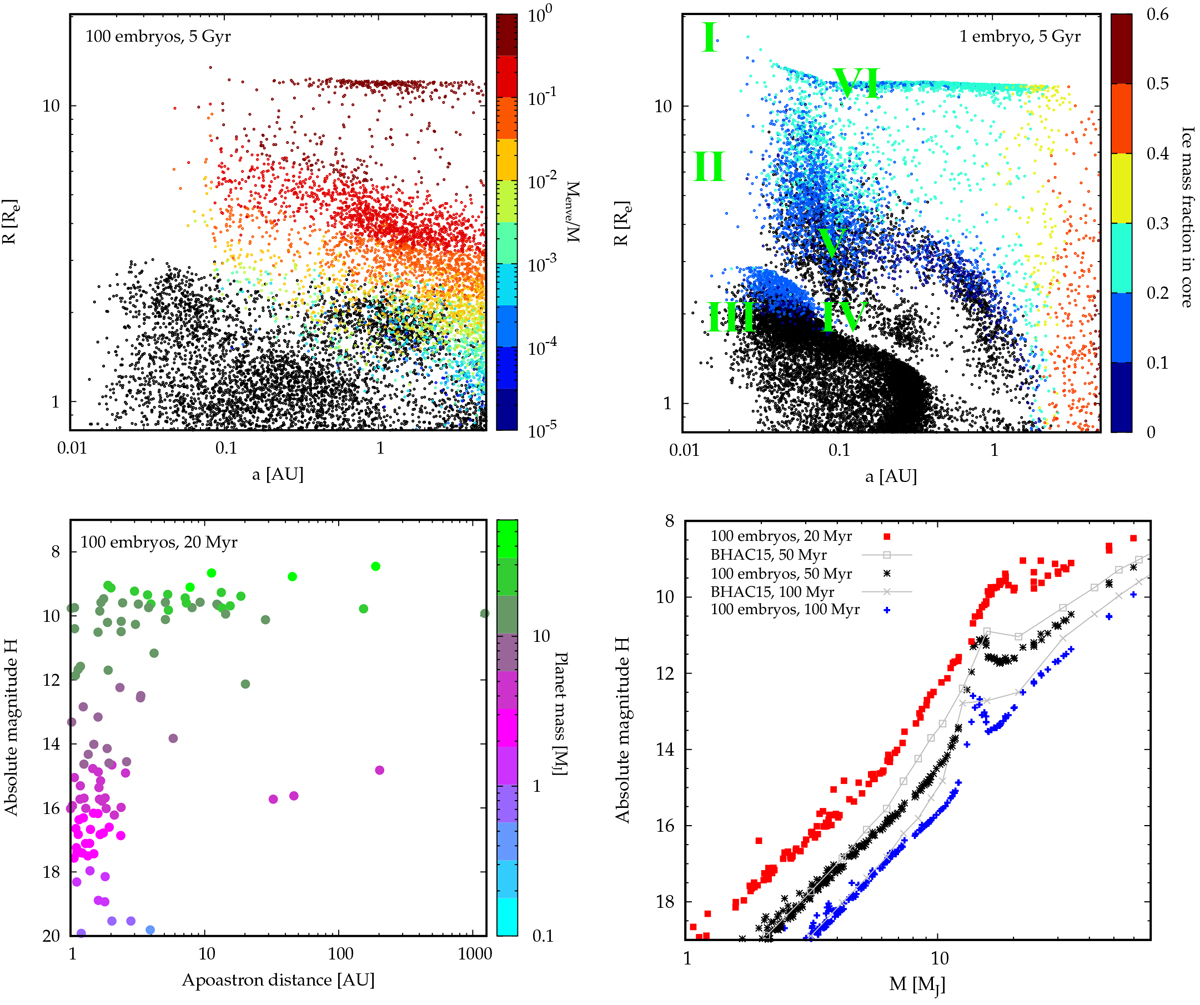
Synthetic populations in the eye of transit and direct imaging surveys. Top left: distance-radius plot of the 100-embryos population at 5 Gyr. The colour code gives the H/He envelope mass fraction. Planets without H/He are shown in black. Top right: distance-radius plot of the single-embryo population, also at 5 Gyr. Roman numerals show important morphological features. The colour code shows here the ice mass fraction in a planet’s core. Black points are planets that do not contain any ice. Bottom left: Apoastron distance versus absolute magnitude in the H band for the 100-embryos population at an age of 20 Myr. The colours show the planets’ mass. Bottom right: H band absolute magnitude as a function of planet mass and age. The isochrones of Baraffe et al. (2015) are also shown for comparison with grey lines.
Current usage metrics show cumulative count of Article Views (full-text article views including HTML views, PDF and ePub downloads, according to the available data) and Abstracts Views on Vision4Press platform.
Data correspond to usage on the plateform after 2015. The current usage metrics is available 48-96 hours after online publication and is updated daily on week days.
Initial download of the metrics may take a while.