Fig. 16
Download original image
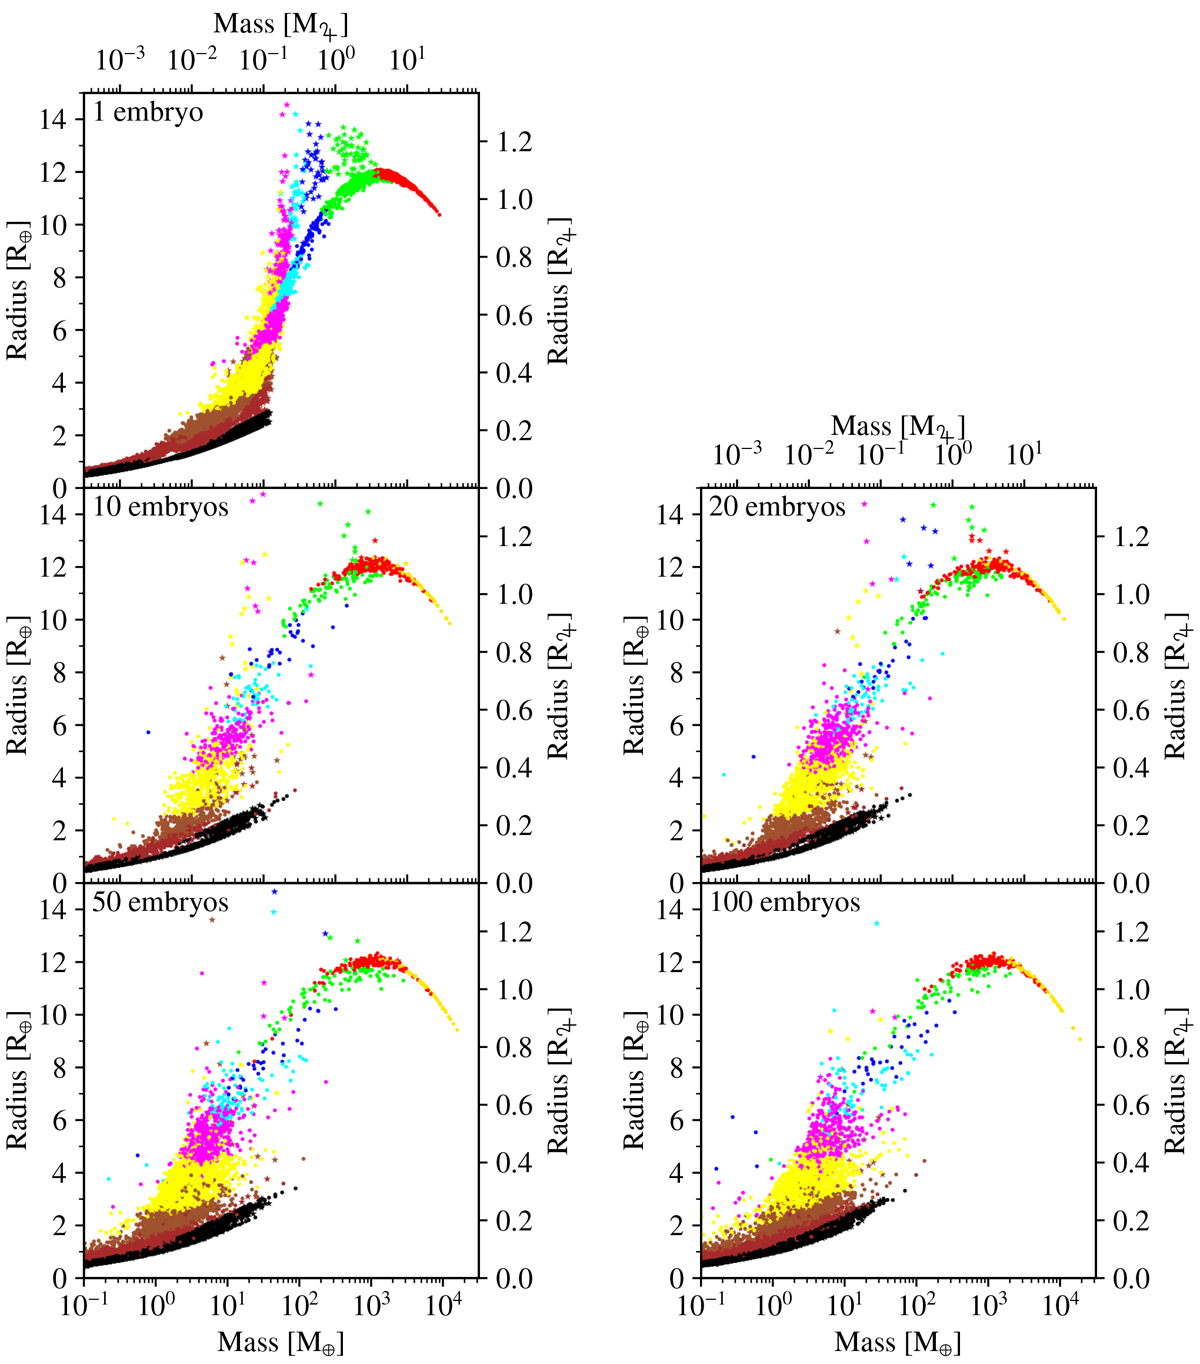
Mass-radius diagram at 5 Gyr obtained from following the long-term thermodynamic evolution of the five populations, as marked in each panel. Atmospheric loss by impacts, atmospheric escape driven by XUV photoevaporation, and bloating are included. The iron and ice mass fraction in the core is considered when calculating the radius. The colours show the bulk solid mass fraction Mcore ∕M, the rest being the H/He envelope: orange: <0.01, red: 0.01–0.05, green: 0.05–0.2, blue: 0.2–0.4, cyan: 0.4–0.6, magenta: 0.6-0.8, yellow: 0.8-0.95, sienna: 0.95–0.99, brown: 0.99–1. Black: no H/He envelope. Star symbols indicate planets who have additional luminosity from bloating, while circles indicate planets that do not.
Current usage metrics show cumulative count of Article Views (full-text article views including HTML views, PDF and ePub downloads, according to the available data) and Abstracts Views on Vision4Press platform.
Data correspond to usage on the plateform after 2015. The current usage metrics is available 48-96 hours after online publication and is updated daily on week days.
Initial download of the metrics may take a while.