Fig. 15
Download original image
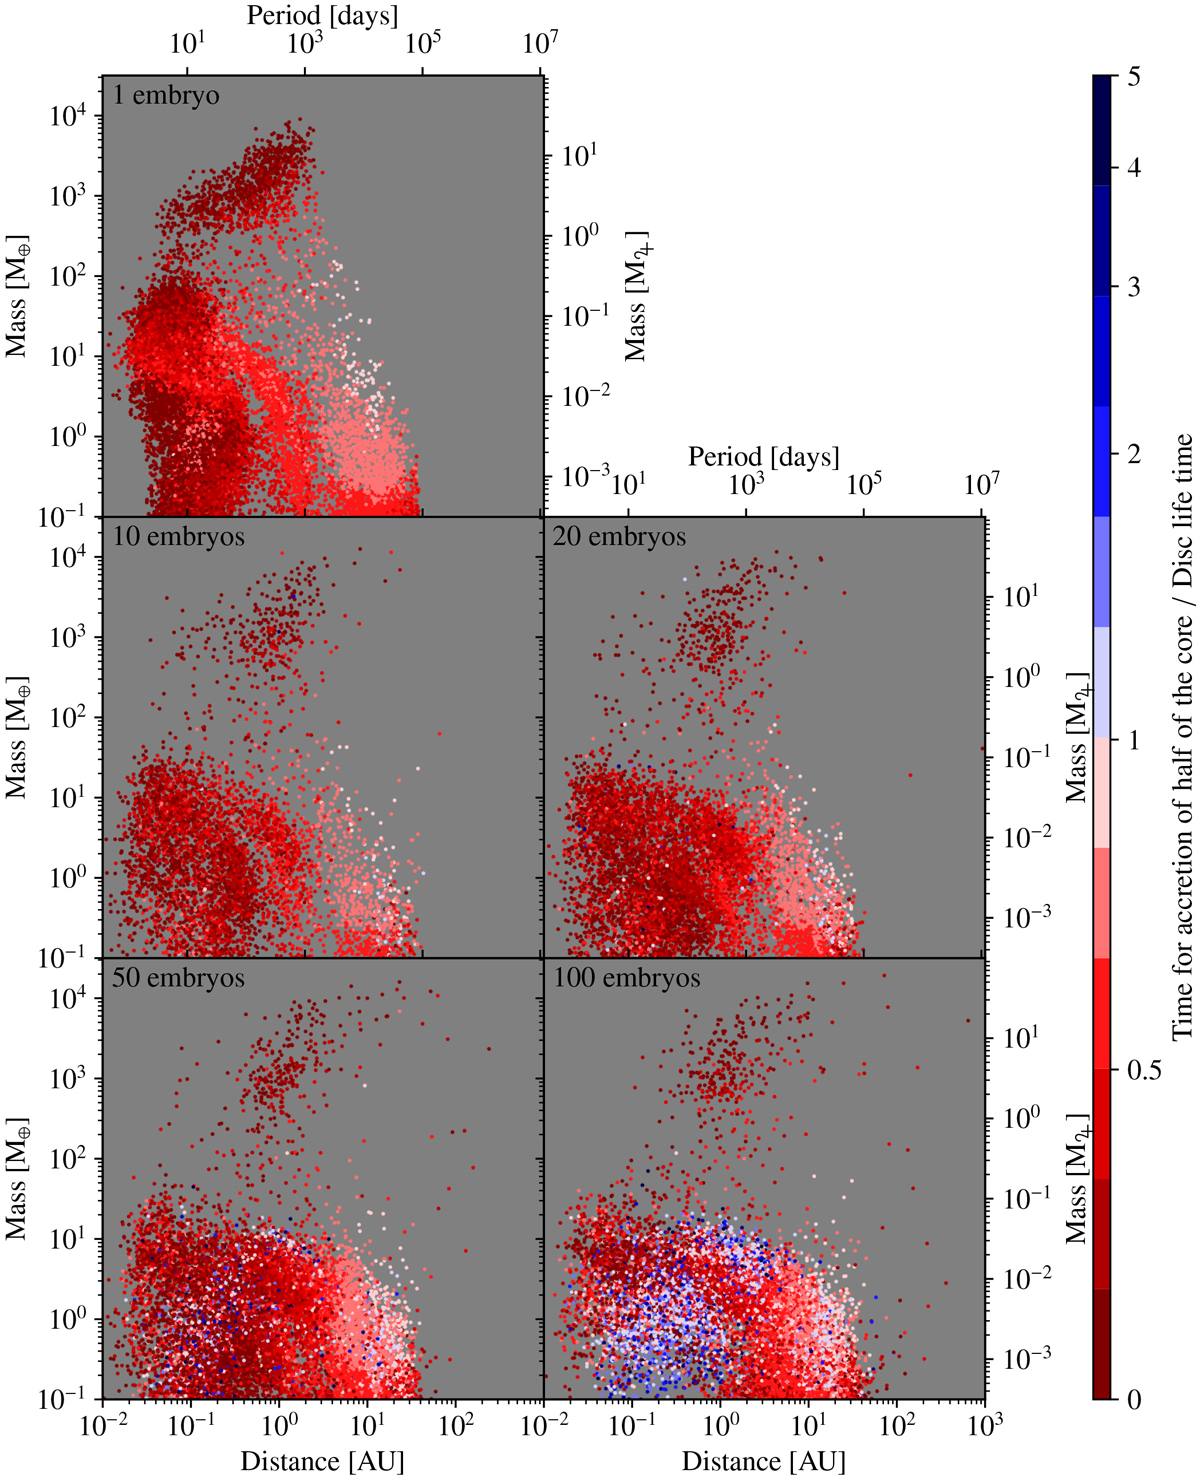
Two dimensional histogram of mass-distance relationship of the five populations shown in this study, with the initial number of embryos per system given in each panel. The dot colours denote the time needed for each planet to accrete halfof their final core mass, given in terms of the disc life times. The scale is linear from 0 to 1, and then logarithmic. The ratio can be larger than unity because we model formation to 20 Myr while the median disc life time is about 4 Myr.
Current usage metrics show cumulative count of Article Views (full-text article views including HTML views, PDF and ePub downloads, according to the available data) and Abstracts Views on Vision4Press platform.
Data correspond to usage on the plateform after 2015. The current usage metrics is available 48-96 hours after online publication and is updated daily on week days.
Initial download of the metrics may take a while.