Fig. 10
Download original image
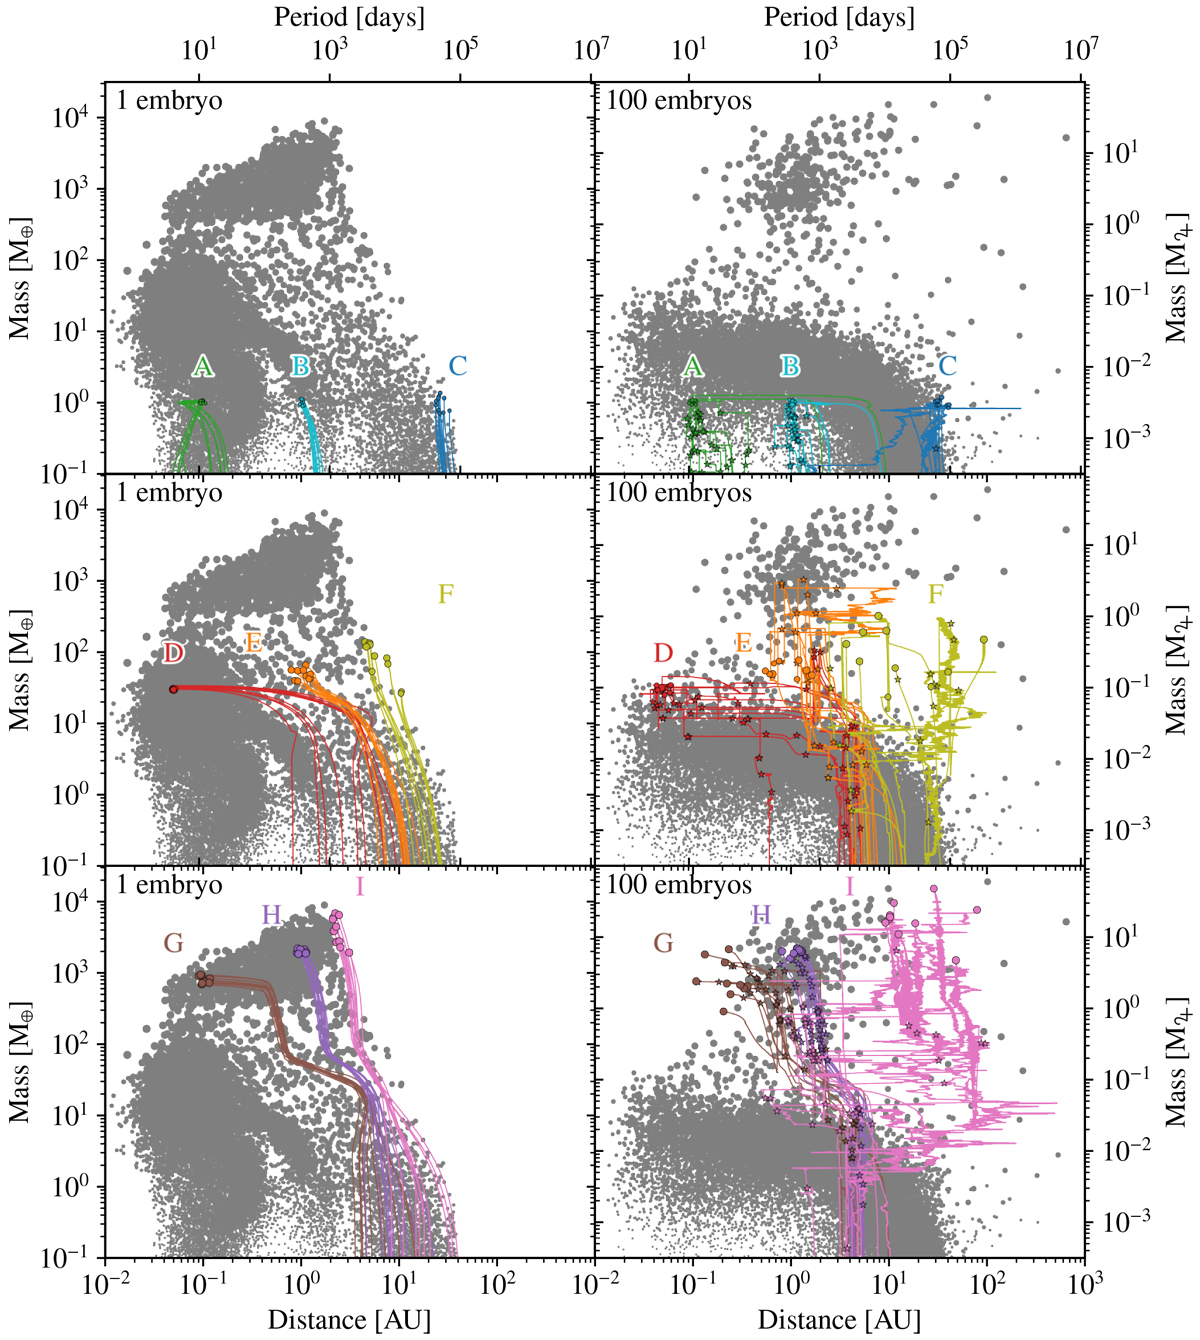
Comparison of the formation tracks between the population with initially 1 (left) and 100 (right) embryos per system and 9 different group of planets labelled A through I, each shown with a different colour. The positions of the groups in the mass-distance diagram are explained in the text. The stars in the 100-embryos population denote the instant at which the planets were hit by other protoplanets (giant impacts).
Current usage metrics show cumulative count of Article Views (full-text article views including HTML views, PDF and ePub downloads, according to the available data) and Abstracts Views on Vision4Press platform.
Data correspond to usage on the plateform after 2015. The current usage metrics is available 48-96 hours after online publication and is updated daily on week days.
Initial download of the metrics may take a while.