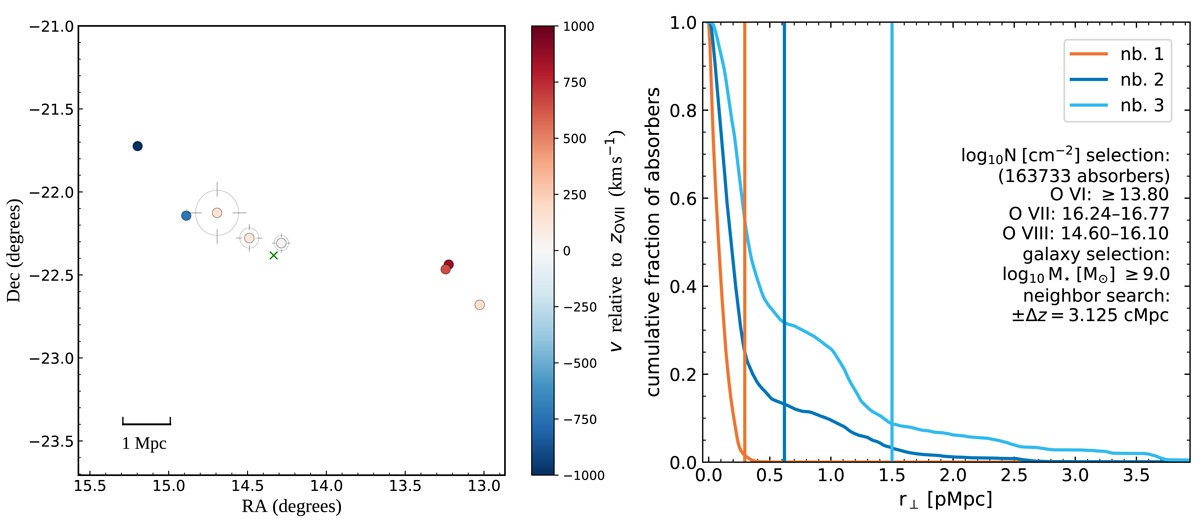
Fig. 9.
Download original image
Left: galactic environment near the examined absorber. The green cross is the Ton S 180 sightline and the filled circles mark all the detected galaxies within |δz|< 0.005 (corresponding to radial depth |δr|< 2 cMpc) of zOVII. Color coding corresponds to relative radial velocities with respect to zOVII as calculated from the spectroscopic redshifts. The circles around the three galaxies with the smallest impact parameters to the sightline show the predicted R200 s along with the expected 68% variation limits (marked with the bars). The proper distance scale at zOVII is shown. Right: the fraction of EAGLE absorbers like those observed for which the galaxy with M* ≳ 109.0 M⊙ and |δr|||< 3.125 cMpc that is closest to the sightline has an impact parameter greater that the value plotted along the x-axis (nb.1: orange curve). The blue and light blue curve show the same for the galaxies with the second and third smallest impact parameters, respectively. The vertical lines show the impact parameters of the three nearest galaxies found in this work (see left panel). We note that the apparently large sample of EAGLE absorbers represents only a small fraction of the total volume (1 × 10⁻⁵).
Current usage metrics show cumulative count of Article Views (full-text article views including HTML views, PDF and ePub downloads, according to the available data) and Abstracts Views on Vision4Press platform.
Data correspond to usage on the plateform after 2015. The current usage metrics is available 48-96 hours after online publication and is updated daily on week days.
Initial download of the metrics may take a while.