Fig. 8.
Download original image
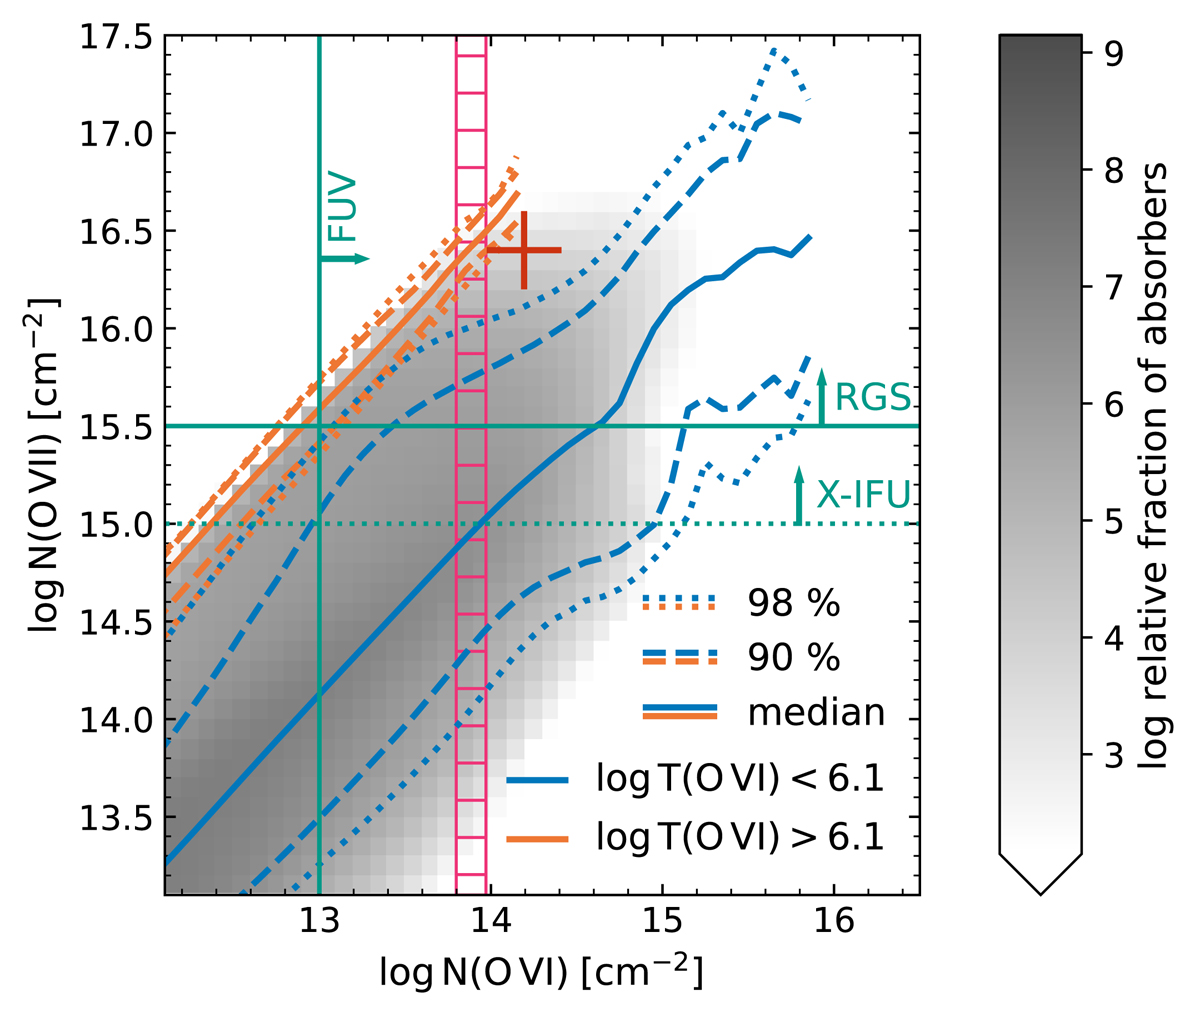
Ion column density distribution of co-located O VI and O VII in EAGLE (gray histogram in the background). The orange contours show the percentiles of NOVII that are counterparts to O VI absorbers with mean ion-weighted O VI temperature > 106.1 K (hot phase) as a function of the total (i.e., for all phases) O VI column density. The blue contours show the same for TOVI < 106.1 K (warm phase). The pink bars indicate the FUV measured warm O VI column density 1σ uncertainty range, whereas the red point marks the total ion columns of the two–phase model (i.e., hot and warm O VI, hot O VII). The green lines mark the approximate detection thresholds for O VI and O VII in FUV and X-ray bands. Detection thresholds for two representative X-ray instruments are shown: the RGS camera on-board XMM-Newton, and the Athena X-IFU, currently under development.
Current usage metrics show cumulative count of Article Views (full-text article views including HTML views, PDF and ePub downloads, according to the available data) and Abstracts Views on Vision4Press platform.
Data correspond to usage on the plateform after 2015. The current usage metrics is available 48-96 hours after online publication and is updated daily on week days.
Initial download of the metrics may take a while.