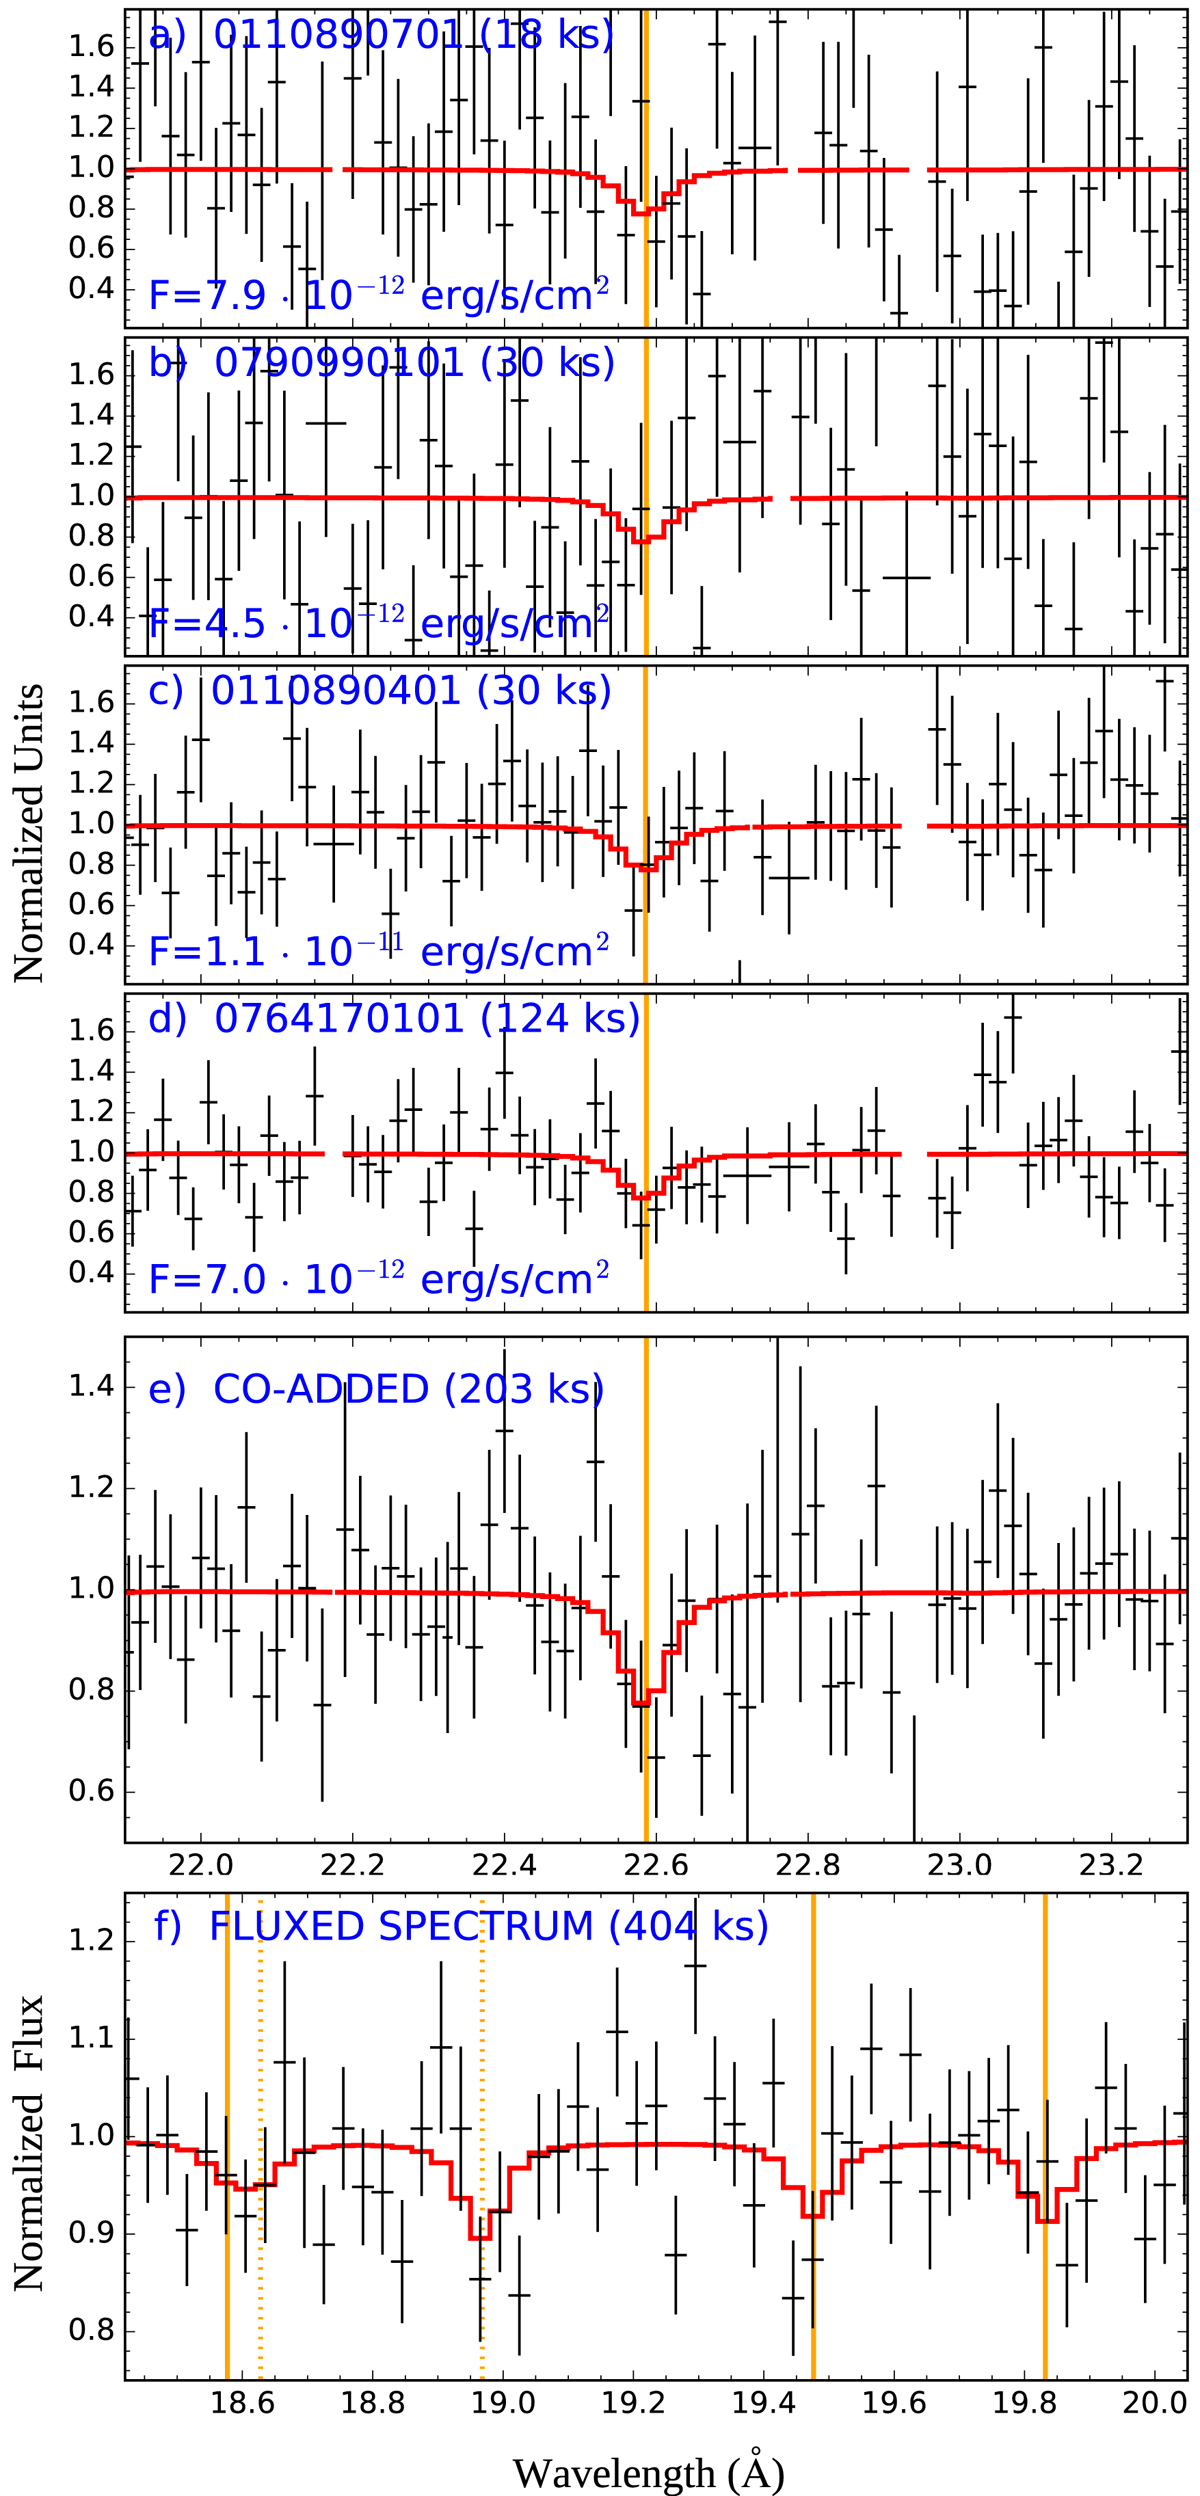
Fig. 4.
Download original image
Panels a–d: continuum normalized RGS1 1st order spectra of the reduced observations (binning factor 2), zoomed in around the z = 0.0455 OVII Heα wavelength, indicated by the orange line. The red curve is the best-fit model including the Galactic and redshifted SPEX ‘hot’ absorption components (Sects. 4, and 6.1). These components were jointly–fitted to the individual spectra (i.e., RGS1–RGS2 1st), whereas the emission continua were fitted independently for the data of each observation. The clean times and the source fluxes (0.5–2 keV) are quoted. Due to the failed RGS2 instrument CCD array #4, and zero effective area of higher dispersion orders above λ ≳ 20 Å, only RGS1 1st order data covers this spectral band. Panel e: Co-added spectrum of the RGS1 1st data at the same band. The absorption model is the same as in panels a–d, but the continuum was fitted to the co-added data. Panel f: a fluxed spectrum (binning factor 3) combining all the reduced RGS data (i.e., RGS1–2 1st and 2nd dispersion orders) at the band containing a set of weaker spectral lines produced by the same best-fit absorption model as above. The centroid wavelengths of the z = 0.0455 lines are marked with solid, and the Galactic lines with dotted, lines. From left to right they are: redshifted O VII Heγ, Galactic O VII Heβ, Galactic O VIII Lyα, redshifted O VII Heβ, redshifted O VIII Lyα. The continuum was fitted to the fluxed spectrum.
Current usage metrics show cumulative count of Article Views (full-text article views including HTML views, PDF and ePub downloads, according to the available data) and Abstracts Views on Vision4Press platform.
Data correspond to usage on the plateform after 2015. The current usage metrics is available 48-96 hours after online publication and is updated daily on week days.
Initial download of the metrics may take a while.