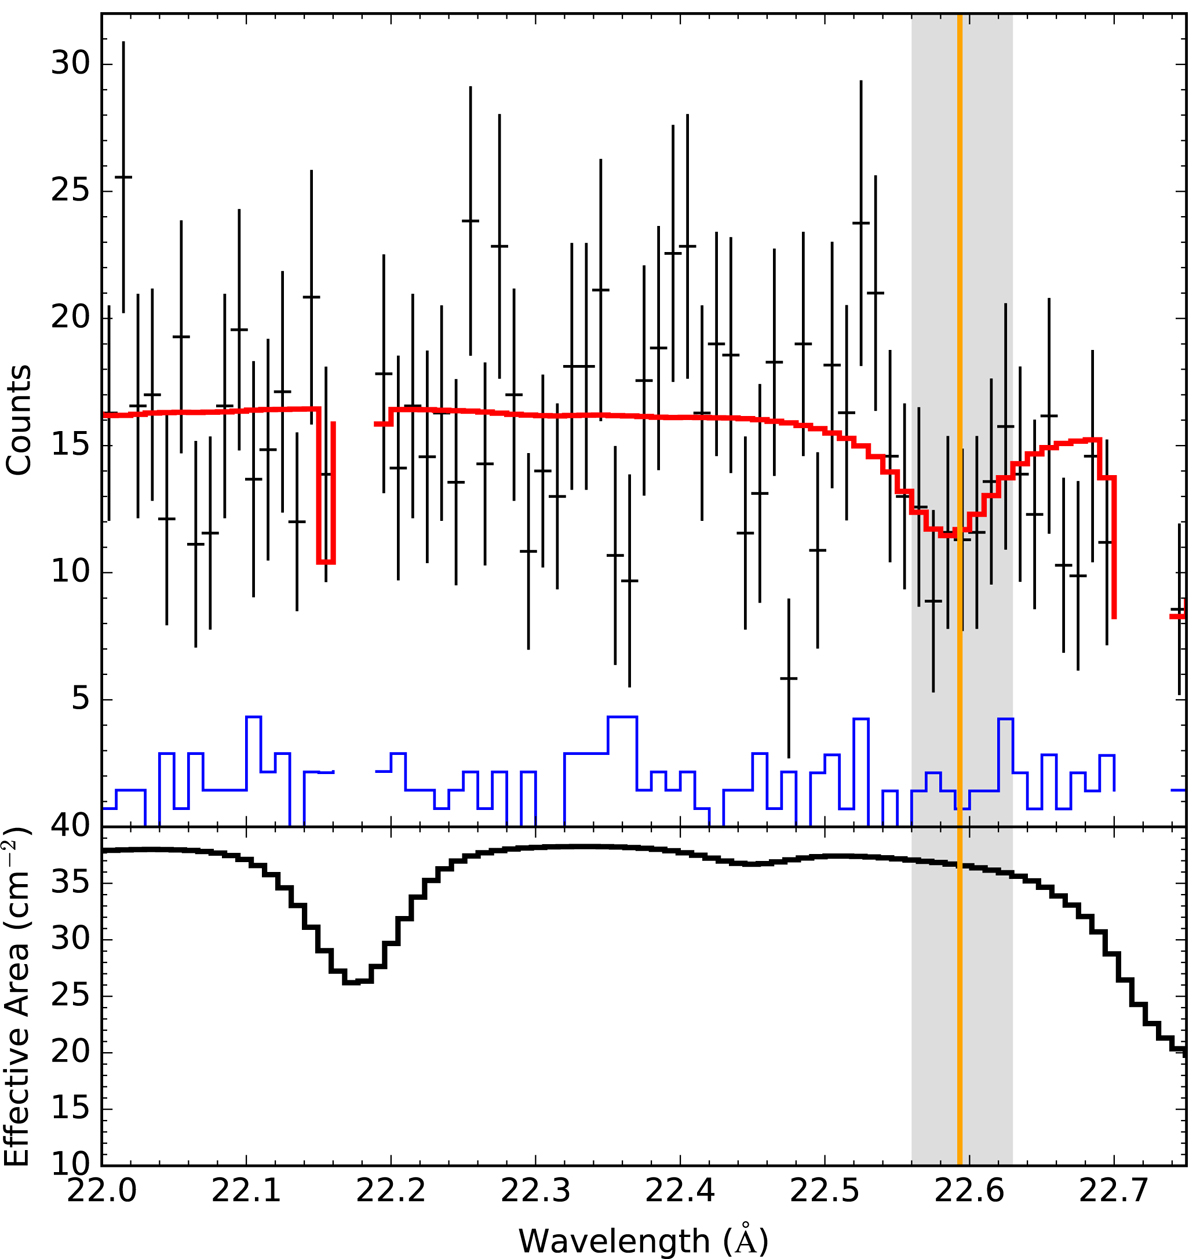
Fig. 2.
Download original image
Top panel: zoom in on the non-binned count spectrum of the longest, 124 ks RGS1 first–order exposure near the detected O VII Heα line. The red curve is the best-fit of the redshifted SPEX ‘slab’ model minimized to the data shown, yielding ion column log NOVII (cm−2) = 16.5, i.e., a value consistent with the main analysis. The orange line marks the predicted O VII line centroid and the blue curve the subtracted background in each channel. The missing data bins were removed by the reduction software due to the bad response (see Sect. 2.1 for details). Below: The effective area of the RGS1 instrument in the corresponding wavelength range, showing two instrumental features.
Current usage metrics show cumulative count of Article Views (full-text article views including HTML views, PDF and ePub downloads, according to the available data) and Abstracts Views on Vision4Press platform.
Data correspond to usage on the plateform after 2015. The current usage metrics is available 48-96 hours after online publication and is updated daily on week days.
Initial download of the metrics may take a while.