Free Access
Fig. 1.
Download original image
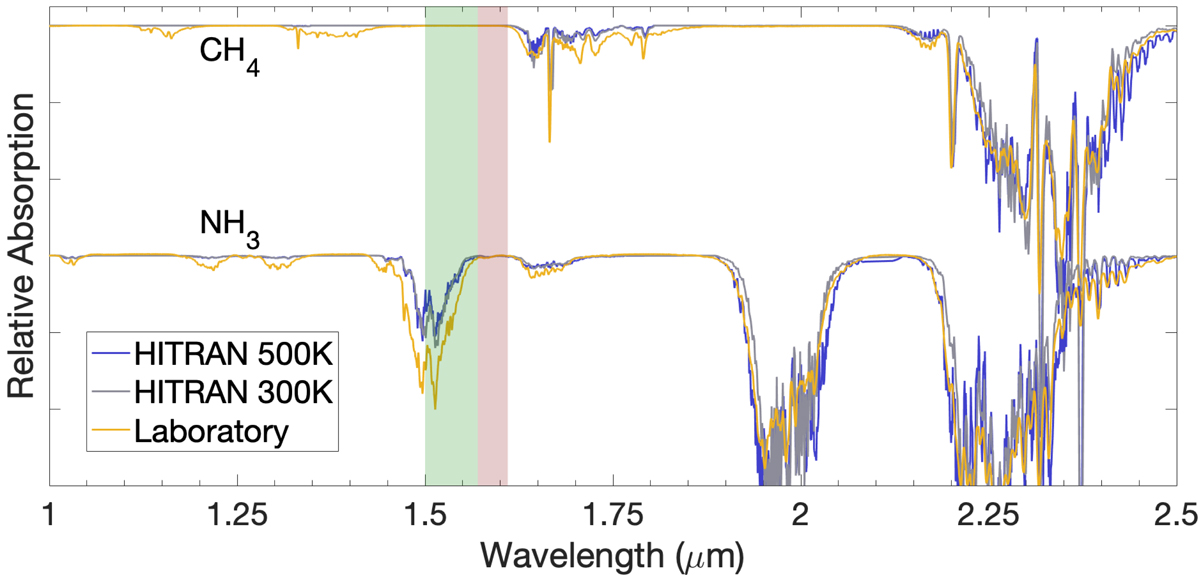
Our laboratory spectrum for ammonia and methane compared to simulated spectra of the same molecules using HITRAN for temperatures of 500 K and 300 K. The wavelength regions proposed for the new NH3-H index are marked with color bands: green for the numerator, red for the denominator.
Current usage metrics show cumulative count of Article Views (full-text article views including HTML views, PDF and ePub downloads, according to the available data) and Abstracts Views on Vision4Press platform.
Data correspond to usage on the plateform after 2015. The current usage metrics is available 48-96 hours after online publication and is updated daily on week days.
Initial download of the metrics may take a while.