Fig. 1.
Download original image
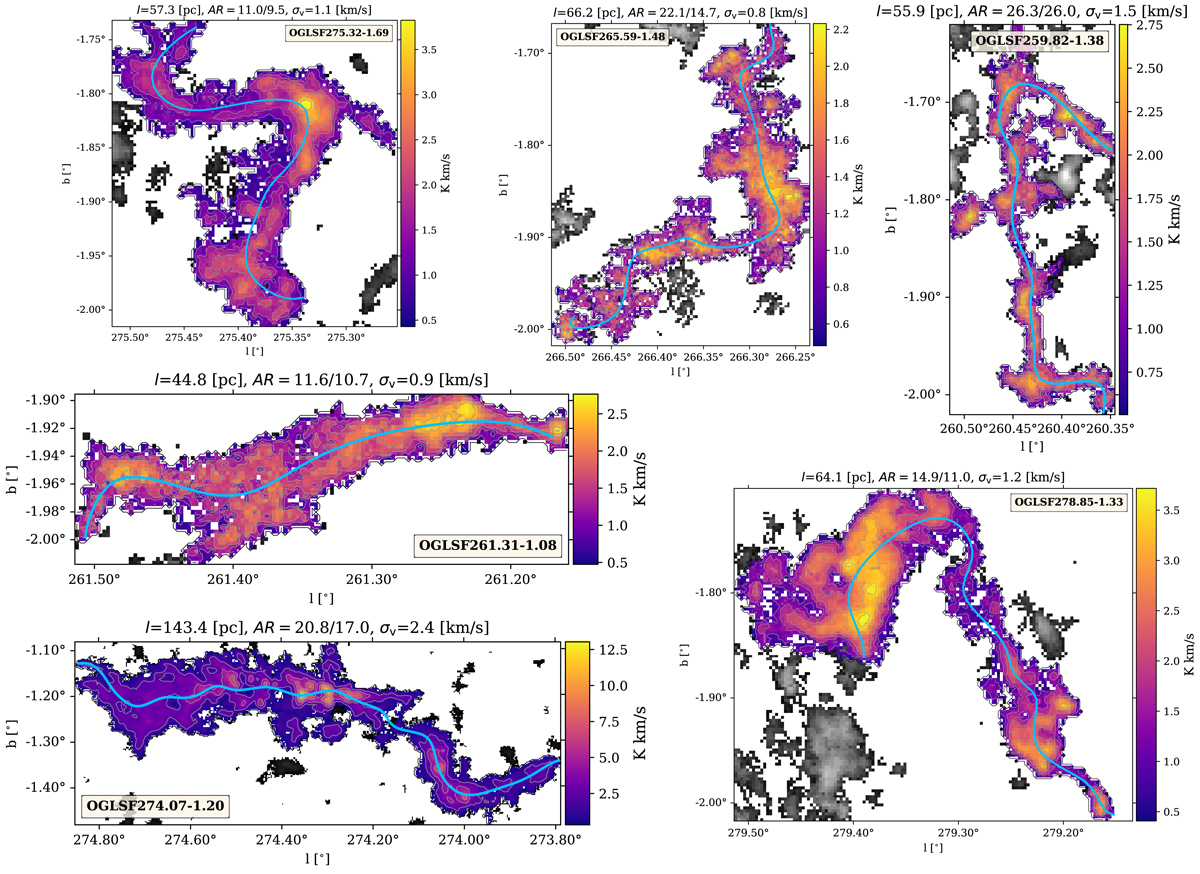
Integrated intensity maps of the 12CO(2-1) emission from some of the most prominent outer Galaxy LSFs identified (in colour) within the structure masked data defined by the dendrogram. In grey-scale, the emission across the line-of-sight that does not belong to the structure is shown. The cyan line displays the filament spine. In the box, the structure name is indicated. In the panel titles, the length (l), the aspect ratio (AR = length/width, with the width inferred from the medial axis method/RadFil), and the velocity dispersion (σv, calculated as the intensity-weighted second moment of velocity) of the structures are shown. The velocity range spanned by the structures is reported in Table C.1 as 5th and 95th percentiles of the LSF velocity distribution.
Current usage metrics show cumulative count of Article Views (full-text article views including HTML views, PDF and ePub downloads, according to the available data) and Abstracts Views on Vision4Press platform.
Data correspond to usage on the plateform after 2015. The current usage metrics is available 48-96 hours after online publication and is updated daily on week days.
Initial download of the metrics may take a while.