Fig. 5.
Download original image
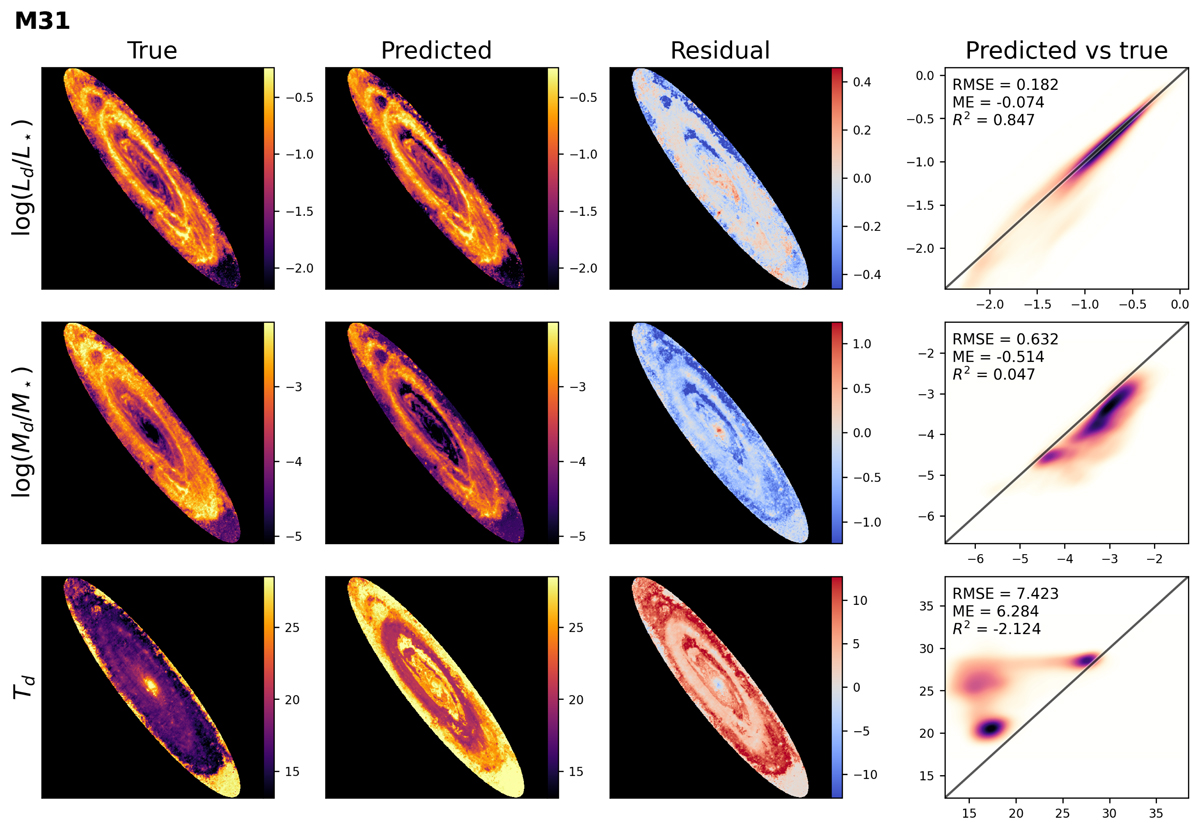
Overview of the predictions on M31 at an 18″ scale. The first three columns show images of the ground truth, ML predictions, and residual (prediction – truth) respectively. The final column compares the ground truth and prediction, similar to Fig. 1. The rows represent sLd, sMd and Td, respectively. In addition to the RMSE and R2 scores, the mean error (ME) is also included in the top left.
Current usage metrics show cumulative count of Article Views (full-text article views including HTML views, PDF and ePub downloads, according to the available data) and Abstracts Views on Vision4Press platform.
Data correspond to usage on the plateform after 2015. The current usage metrics is available 48-96 hours after online publication and is updated daily on week days.
Initial download of the metrics may take a while.