Fig. 4.
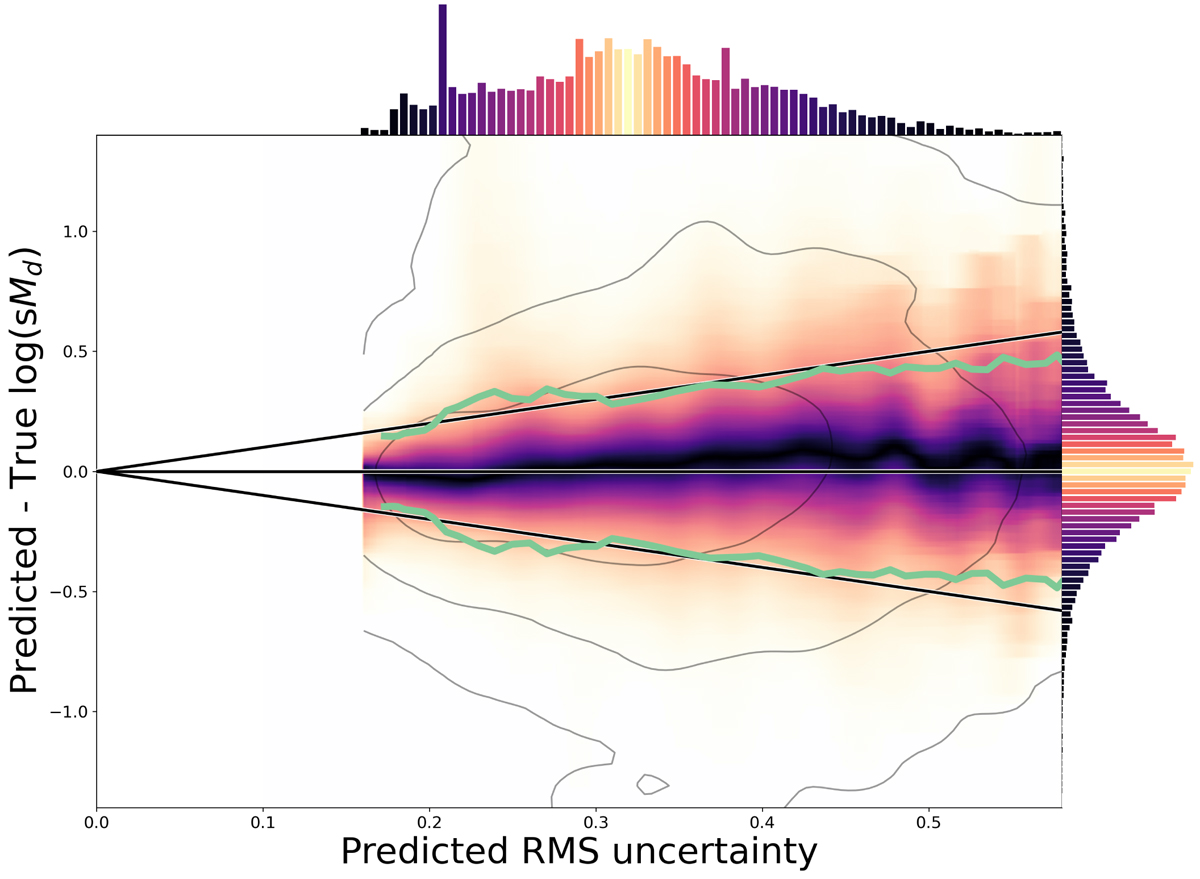
Download original image
Validating the predicted uncertainties of the specific dust mass on 18″ scales. The ordinate shows the difference between the predicted log(sMd) and the ground truth, also known as the prediction error. The abscissa shows the uncertainty predicted by the xgboost model. The colour is not a KDE estimate as in the previous figures, but instead shows the percentile, with the brightest values being used for the median. The bright green line shows a binned RMS of the prediction error. Both the percentile and RMS are binned in the abscissa, i.e. always considering a constant predicted uncertainty. The contours show a KDE estimate and these contours contain 68.3%, 95.5% and 99.7% of the pixels. As done before, all pixels are weighted inversely proportional to the number of pixels in that galaxy.
Current usage metrics show cumulative count of Article Views (full-text article views including HTML views, PDF and ePub downloads, according to the available data) and Abstracts Views on Vision4Press platform.
Data correspond to usage on the plateform after 2015. The current usage metrics is available 48-96 hours after online publication and is updated daily on week days.
Initial download of the metrics may take a while.