Fig. 8
Download original image
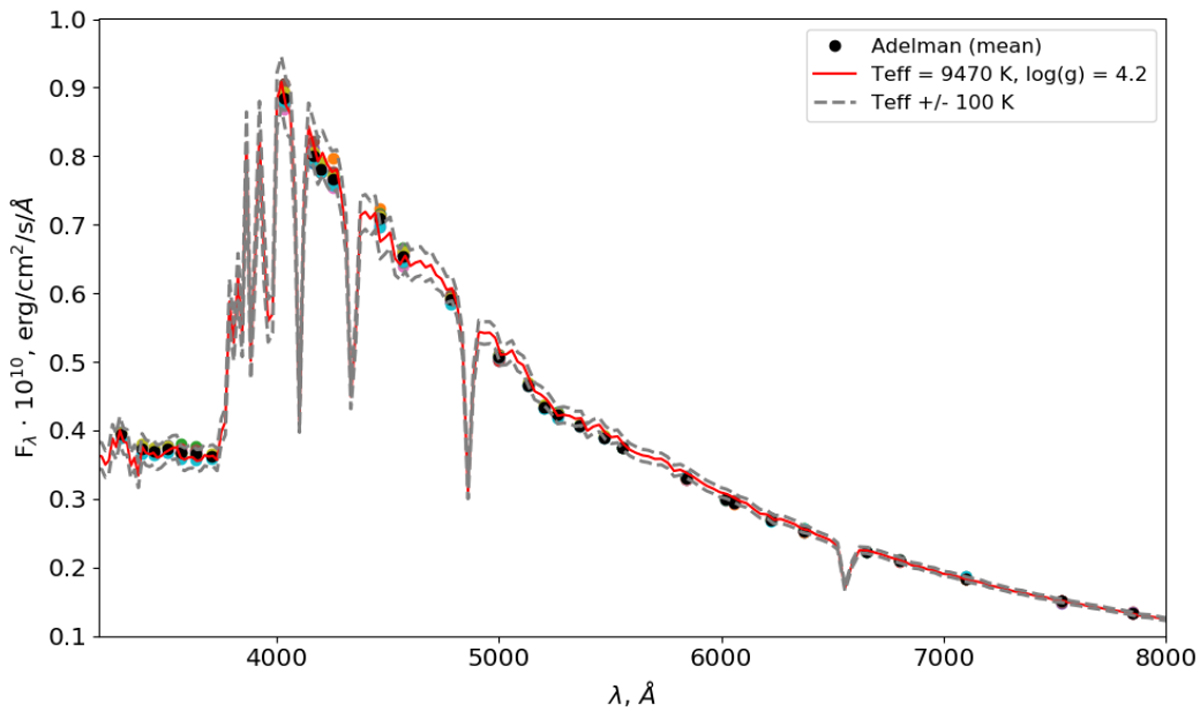
Comparison between the observed Adelman spectrophotometric scans (colour symbols) and theoretical SED for HD 220825. The solid red line shows the theoretical energy distribution computed for the final self-consistent model atmosphere of HD 220825 with parameters Teff = 9470 K and logg = 4.2. The dashed grey lines illustrate the effect of changing Teff by ±100 K. The averaged spectrophotometric scan is represented by filled black circles.
Current usage metrics show cumulative count of Article Views (full-text article views including HTML views, PDF and ePub downloads, according to the available data) and Abstracts Views on Vision4Press platform.
Data correspond to usage on the plateform after 2015. The current usage metrics is available 48-96 hours after online publication and is updated daily on week days.
Initial download of the metrics may take a while.