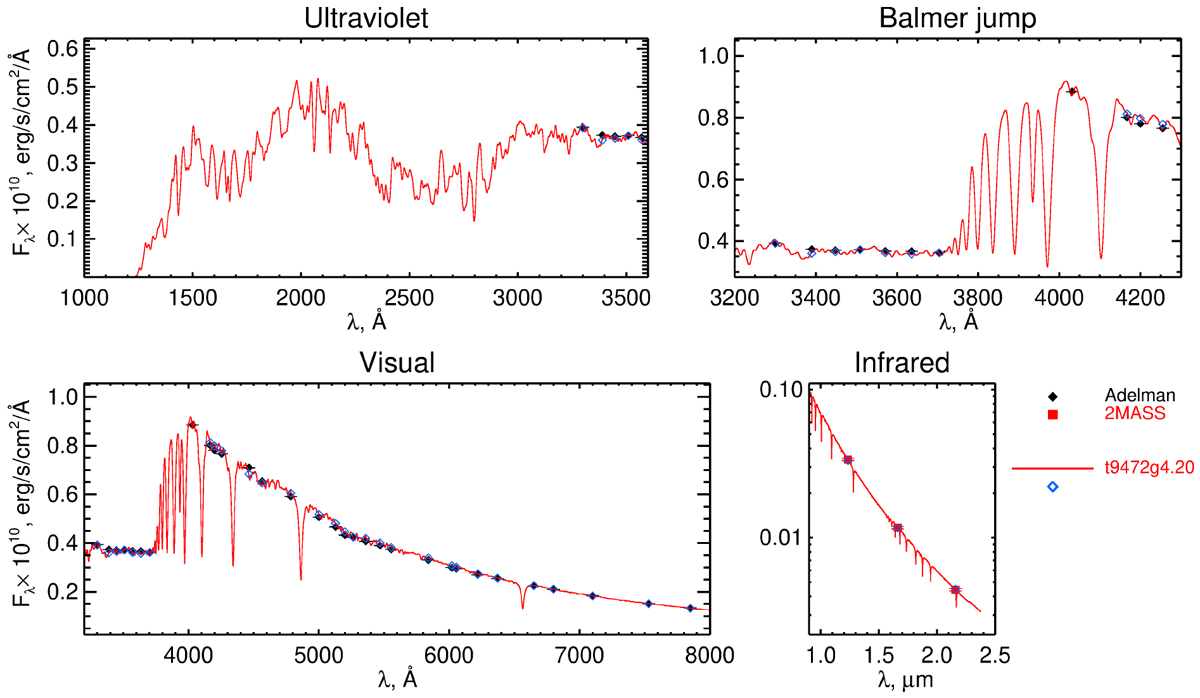
Fig. 5
Download original image
Comparison of the observed energy distribution from Adelman (filled black diamonds), TD1 (filled black squares) and 2MASS photometric data (filled red squares) with the best-fit theoretical flux (solid red line) calculated after five abundance analysis iterations for the LLMODELS atmosphere of HD 120198 with the parameters Teff = 10173 K and logg = 4.2. Open blue diamonds show the theoretical fluxes convolved with the corresponding filters. The shaded area illustrates the spectral regions that were excluded from the fit.
Current usage metrics show cumulative count of Article Views (full-text article views including HTML views, PDF and ePub downloads, according to the available data) and Abstracts Views on Vision4Press platform.
Data correspond to usage on the plateform after 2015. The current usage metrics is available 48-96 hours after online publication and is updated daily on week days.
Initial download of the metrics may take a while.