Fig. 3
Download original image
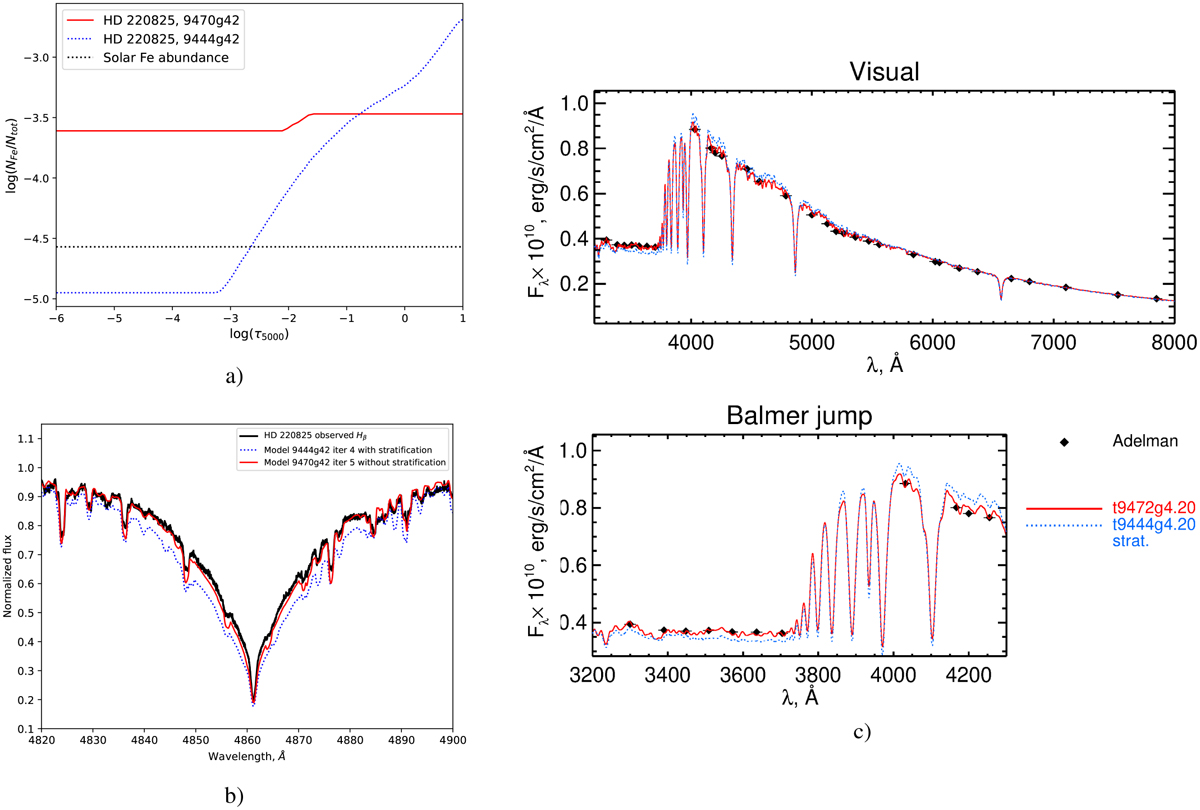
(a) Vertical abundance distribution (stratification) of Fe in the atmosphere of HD 220825 derived for model 9470g42 (red line) and for model 9444g42 (dotted blue line). The solar abundance is denoted by the dotted black line. (b) Comparison of the observed Hβ line profile in the atmosphere of HD 220825 (black line) with theoretical profiles calculated assuming stratified (dotted blue line) and chemically homogeneous atmospheres (red line). (c) Comparison between the observed and best-fit theoretical SEDs calculated with (dotted blue line) and without (solid red line) stratification. Observed SED data in the visual spectral region and around the Balmer jump are shown with filled black diamonds.
Current usage metrics show cumulative count of Article Views (full-text article views including HTML views, PDF and ePub downloads, according to the available data) and Abstracts Views on Vision4Press platform.
Data correspond to usage on the plateform after 2015. The current usage metrics is available 48-96 hours after online publication and is updated daily on week days.
Initial download of the metrics may take a while.