Fig. 3.
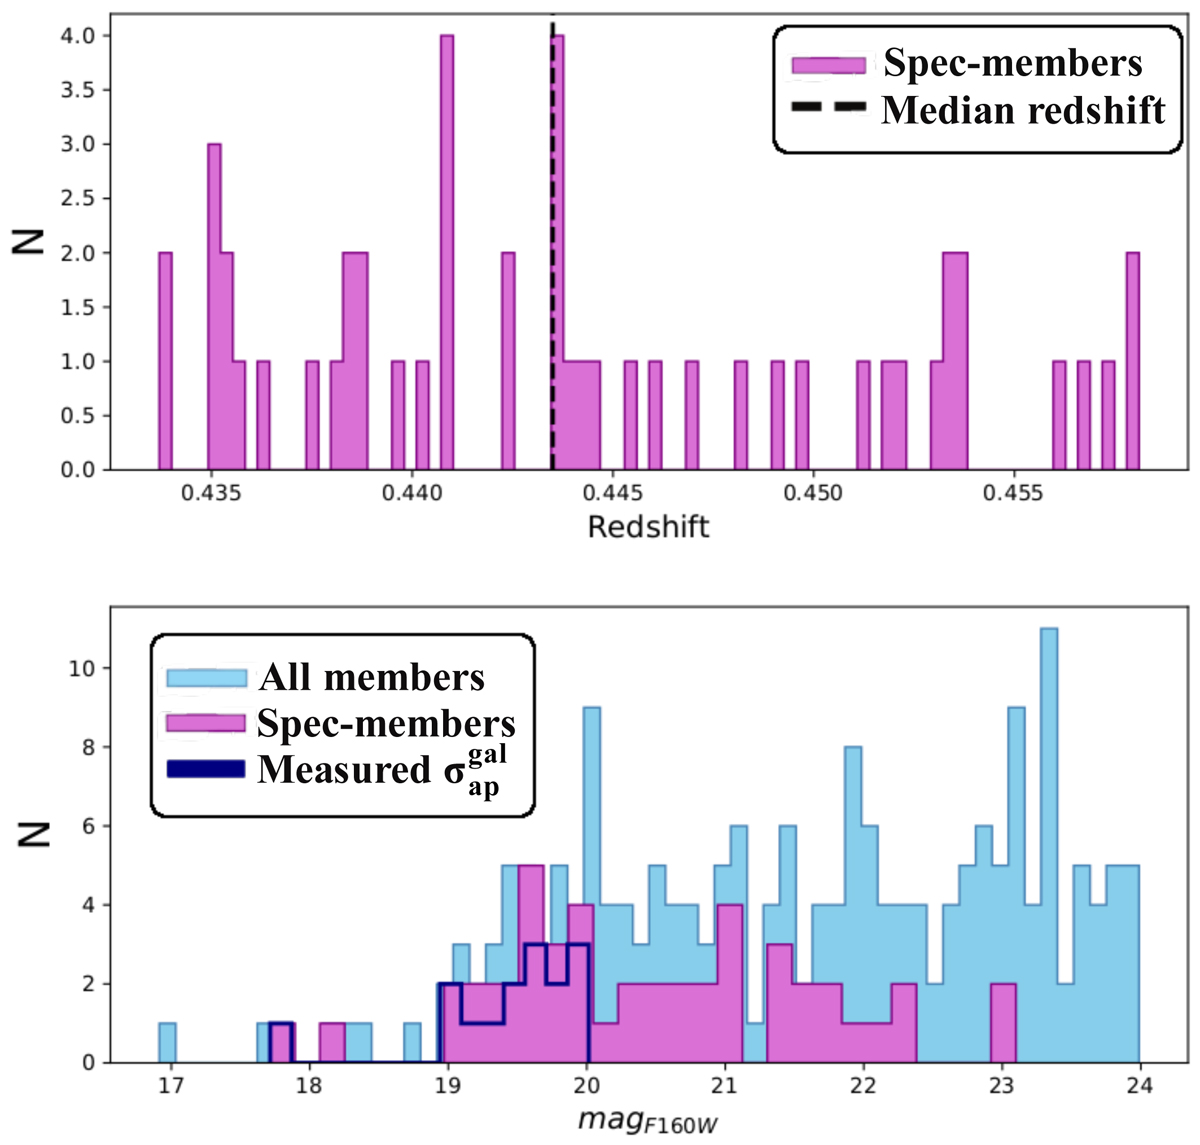
Download original image
Upper panel: redshift distribution of the spectroscopically confirmed cluster galaxies with velocities within ±3000 km s−1 from the median cluster redshift, z = 0.4436 (black dashed line). Bottom panel: magnitude distribution for the cluster galaxies in the F160W band. The light-blue filled histogram shows the distribution of all 197 cluster members in our catalog, while the magenta histogram refers to the 46 spectroscopically confirmed members. The magnitude distribution of the 15 cluster members for which we could measure the velocity dispersion is given by the blue histogram.
Current usage metrics show cumulative count of Article Views (full-text article views including HTML views, PDF and ePub downloads, according to the available data) and Abstracts Views on Vision4Press platform.
Data correspond to usage on the plateform after 2015. The current usage metrics is available 48-96 hours after online publication and is updated daily on week days.
Initial download of the metrics may take a while.