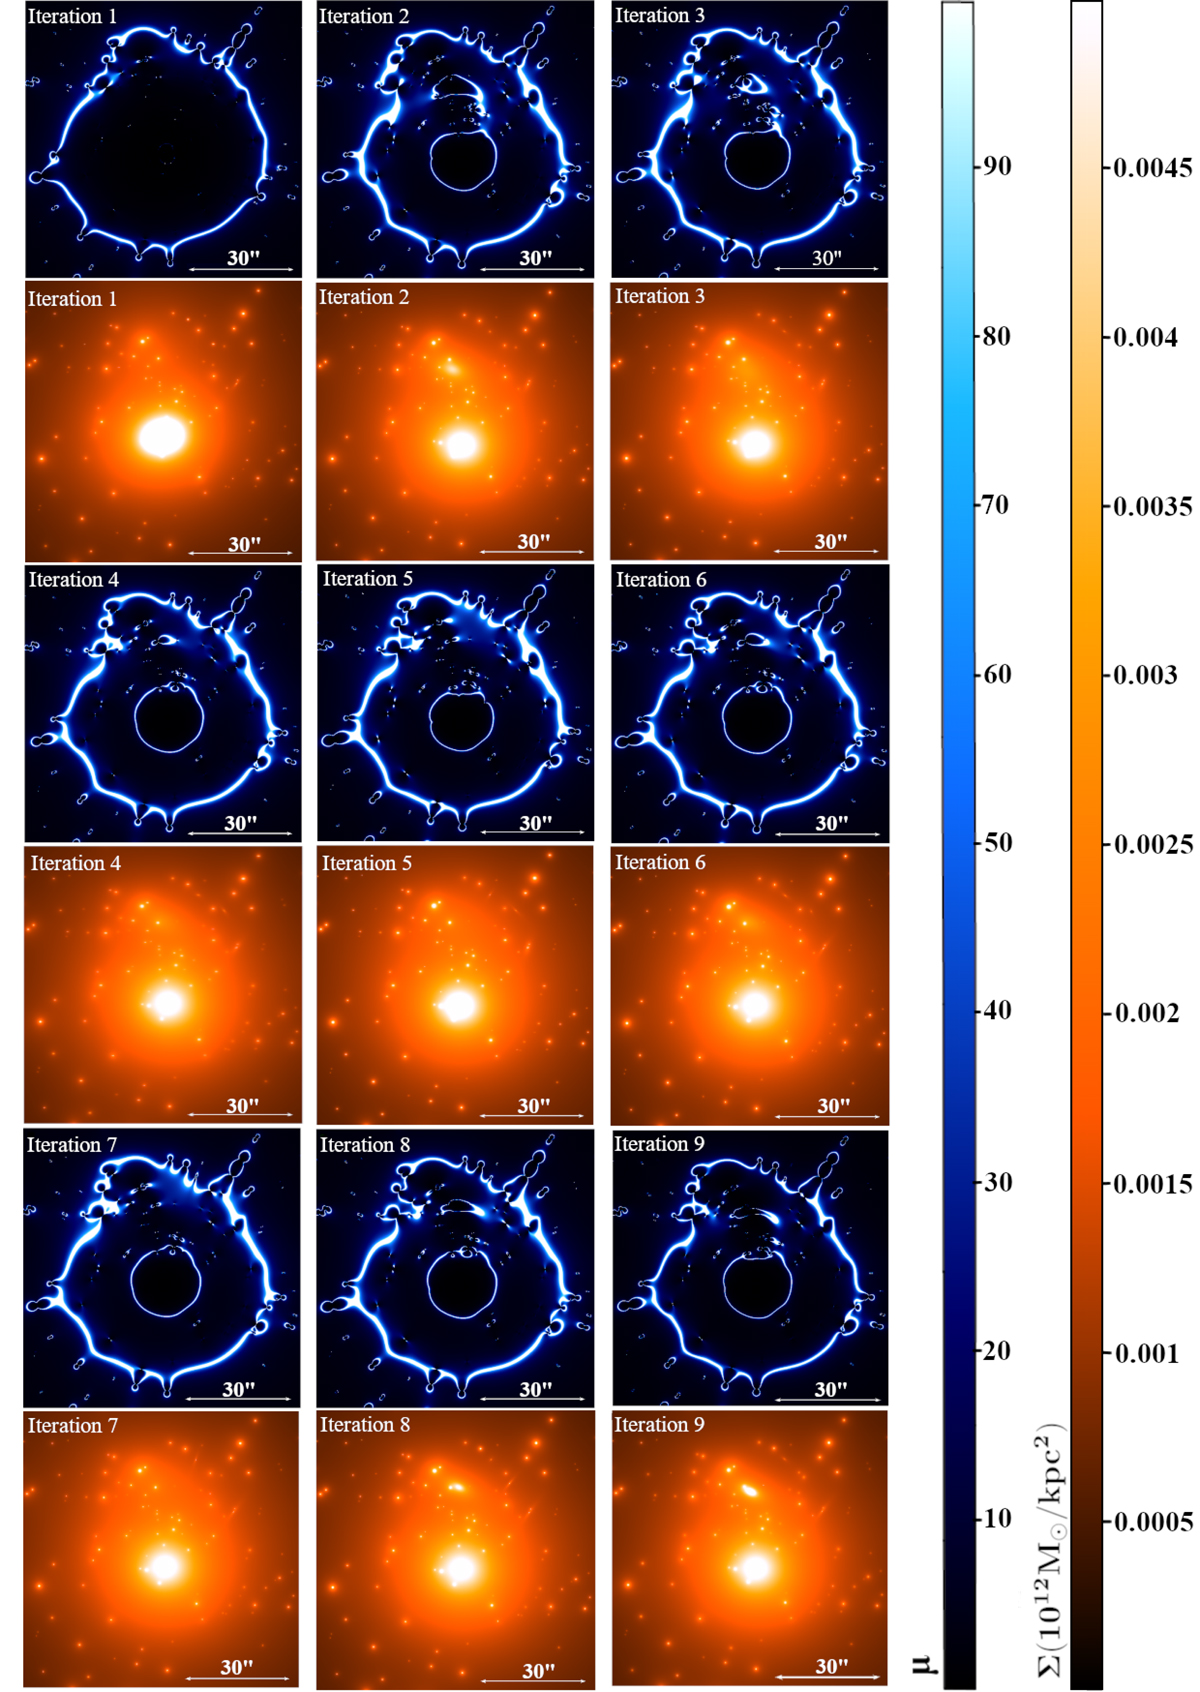
Fig. A.1.
Download original image
Surface density and magnification maps after each iteration of the model refinement. The magnification maps are visualized using a blue-gradient color scale, saturated at μ = 100. The maps are calculated assuming a source redshift of zs = 2.3702. The white color indicates the location of the lens critical lines for this source redshift.
Current usage metrics show cumulative count of Article Views (full-text article views including HTML views, PDF and ePub downloads, according to the available data) and Abstracts Views on Vision4Press platform.
Data correspond to usage on the plateform after 2015. The current usage metrics is available 48-96 hours after online publication and is updated daily on week days.
Initial download of the metrics may take a while.