Fig. 6

Download original image
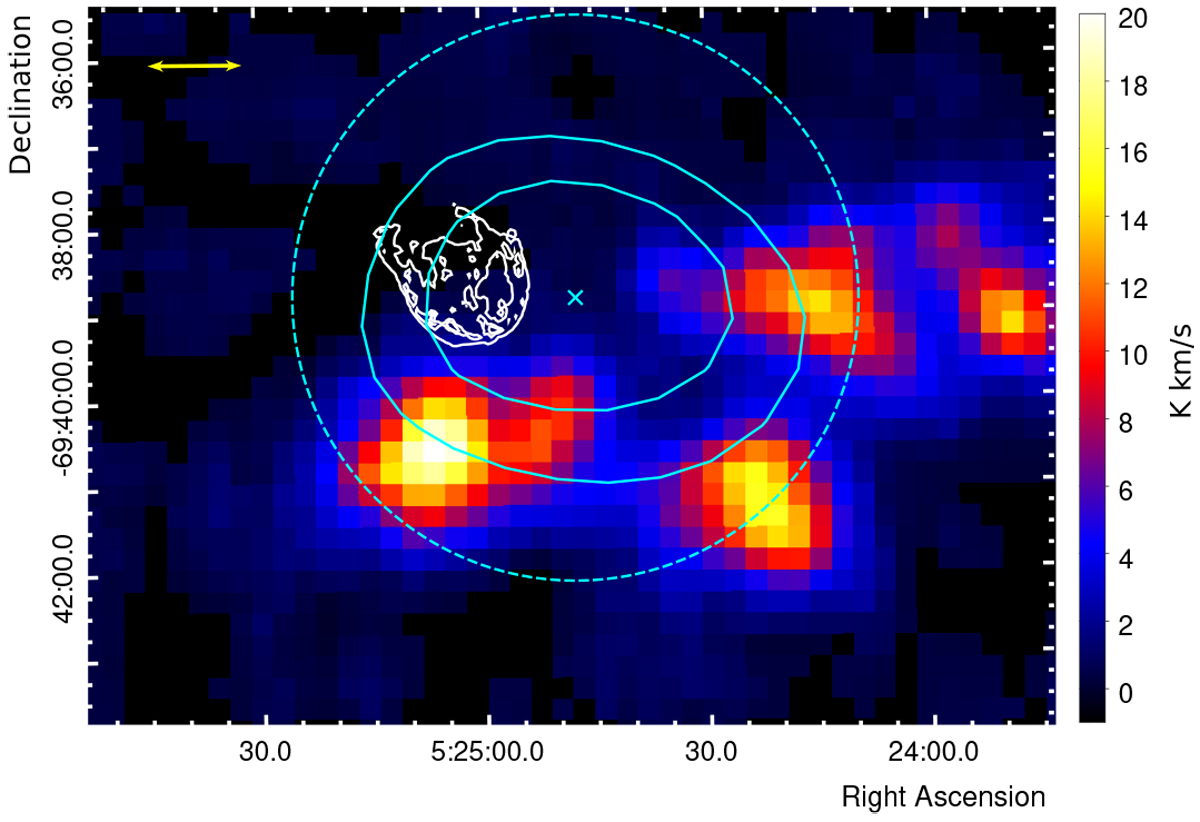
Molecular clouds in the vicinity of N132D. The image shows the CO emission (color scale in K km s−1) from the MAGMA survey (Wong et al. 2011)5. White contours denote Chandra X-ray emission from N132D6 (Borkowski et al. 2007). The best-fit position of the gamma-ray emission is denoted by the cross, and the elliptical contours are the confidence regions of the position at 2 and 3σ. The dashed circle illustrates the 99% CL UL on the extension established at 3.3′. The scale bar indicates 1′.
Current usage metrics show cumulative count of Article Views (full-text article views including HTML views, PDF and ePub downloads, according to the available data) and Abstracts Views on Vision4Press platform.
Data correspond to usage on the plateform after 2015. The current usage metrics is available 48-96 hours after online publication and is updated daily on week days.
Initial download of the metrics may take a while.


