Fig. 2

Download original image
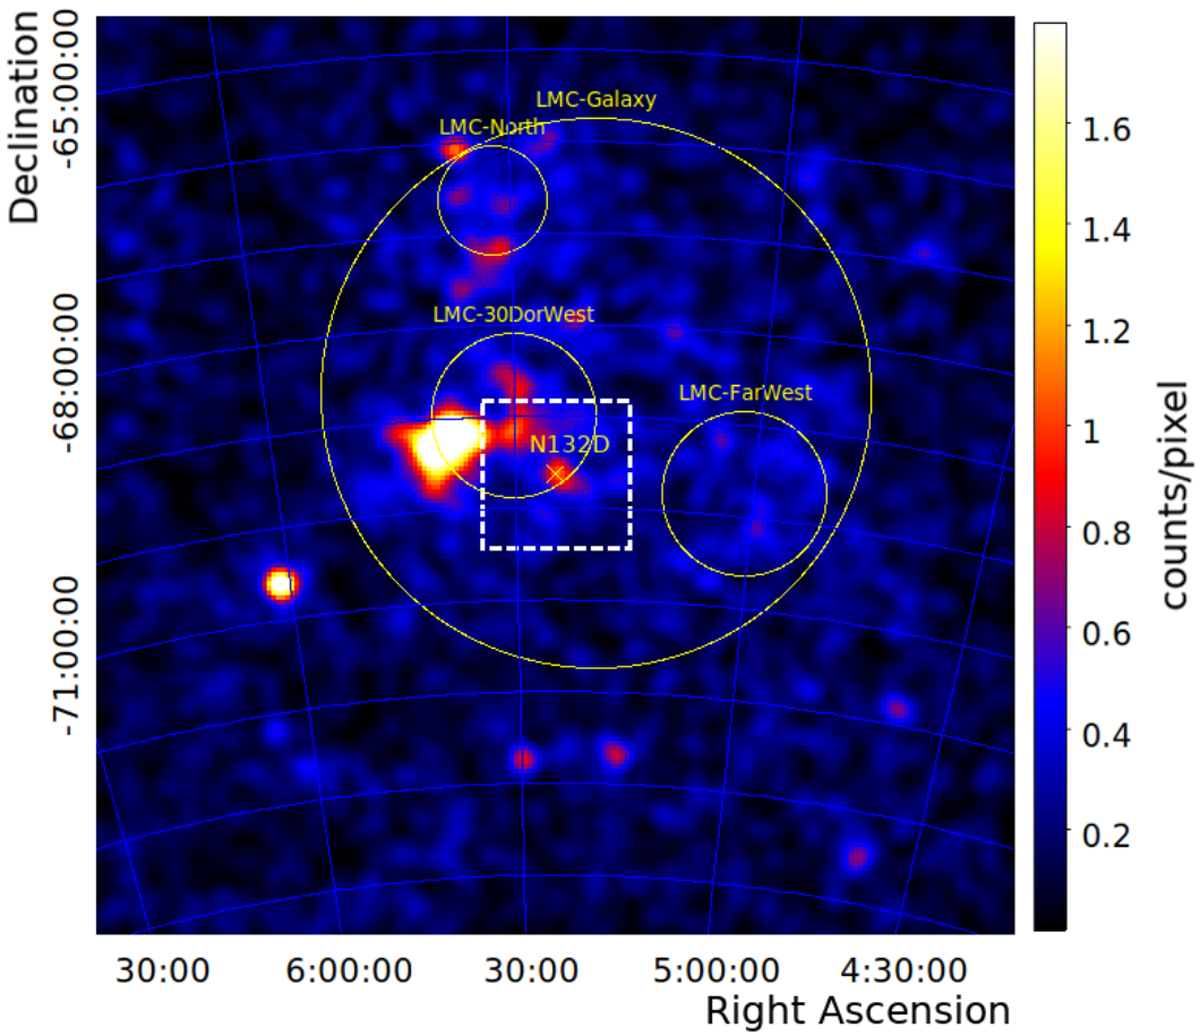
Gaussian (σ = 0. °2) kernel smoothed Fermi-LAT count map centered on the position of N132D for the energy range 3–250 GeV. The central dashed box corresponds to the FoV of the H.E.S.S. excess map shown in Fig. 1. The bright Fermi-LAT sources at the eastern edge of the LMC-30 DorWest region are N157B and PSR B0540-69. Their emissions overlap at this resolution.
Current usage metrics show cumulative count of Article Views (full-text article views including HTML views, PDF and ePub downloads, according to the available data) and Abstracts Views on Vision4Press platform.
Data correspond to usage on the plateform after 2015. The current usage metrics is available 48-96 hours after online publication and is updated daily on week days.
Initial download of the metrics may take a while.


