Fig. 7
Download original image
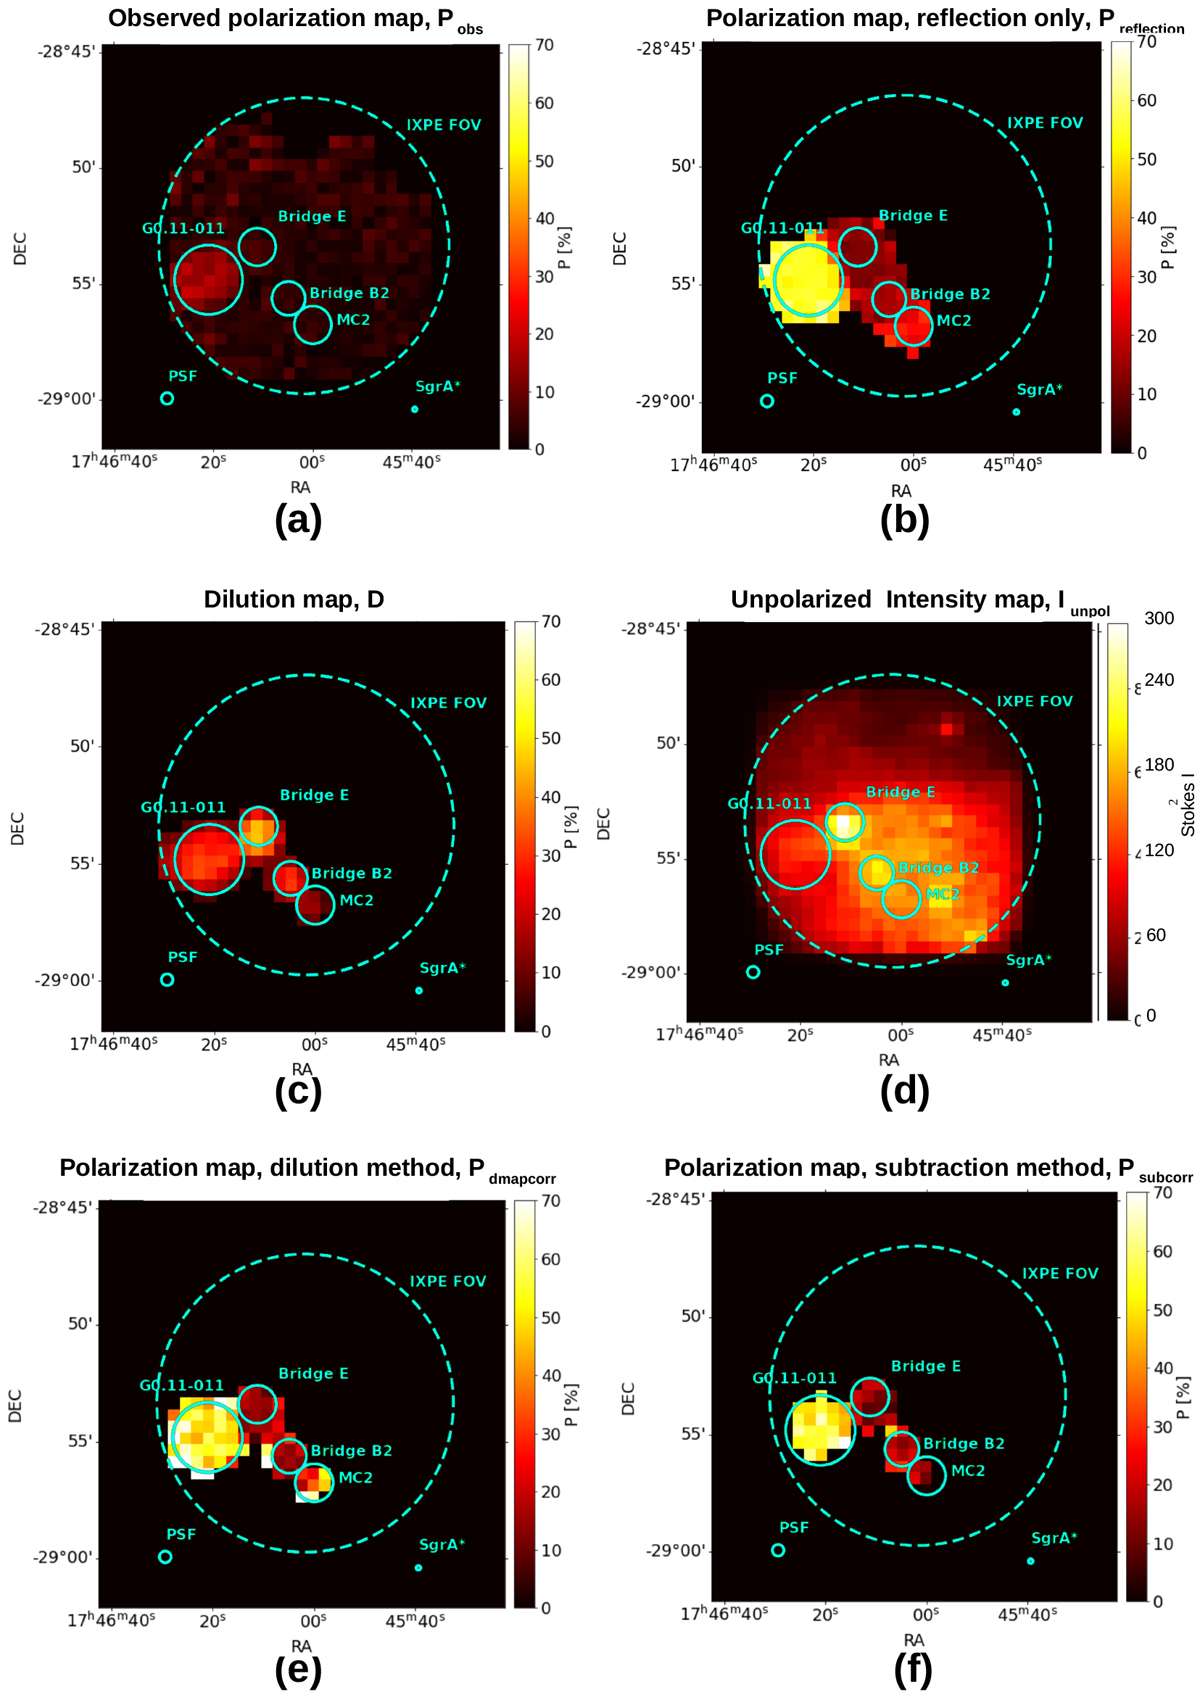
Maps of the Sgr A complex IXPE FOV. (a) Observed polarization map. For clarity, we show the results for an average of 100 simulations. (b) Polarization map when only the MC reflection component is considered. (c) Dilution map. (d) Unpolarized intensity Stokes parameter map. (e) Reconstructed polarization map from dilution map method. (f) Reconstructed polarization map from subtraction method. The IXPE FOV and the cloud regions are displayed as in Fig. 5. For the maps (a), (b), (c), (e), and (f) the color-bar displays the polarization degee. For map (d) it displays the Stokes intensity parameter. The maps have a 30″ spatial binning and are obtained in the 4–8 keV energy band.
Current usage metrics show cumulative count of Article Views (full-text article views including HTML views, PDF and ePub downloads, according to the available data) and Abstracts Views on Vision4Press platform.
Data correspond to usage on the plateform after 2015. The current usage metrics is available 48-96 hours after online publication and is updated daily on week days.
Initial download of the metrics may take a while.